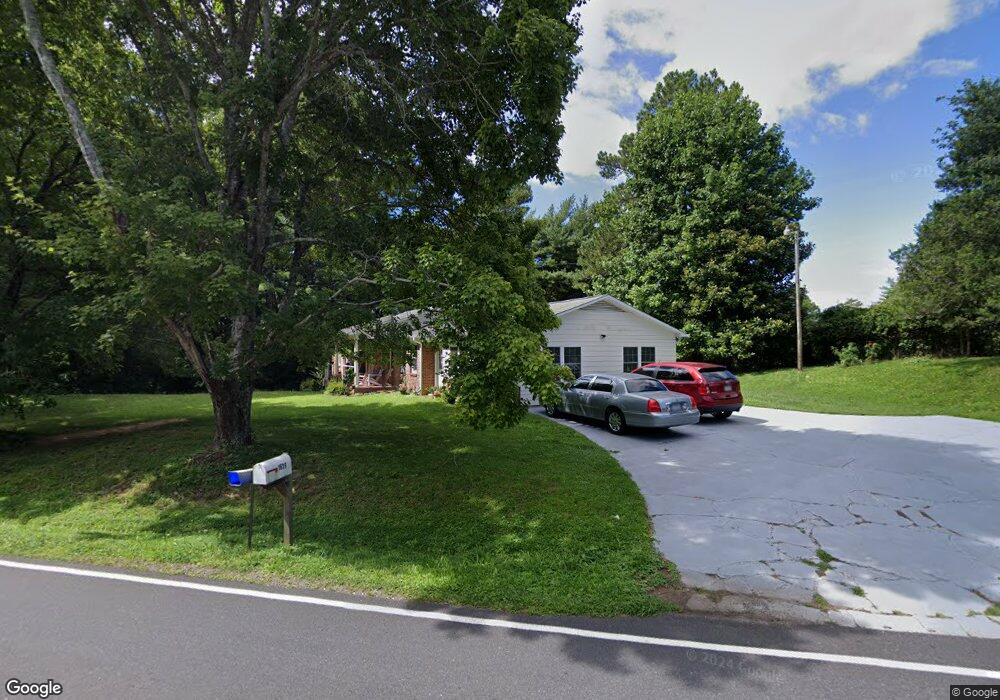
1629 Nc 126 None Unit 1 Morganton, NC 28655
Estimated Value: $245,000 - $382,000
3
Beds
2
Baths
2,248
Sq Ft
$148/Sq Ft
Est. Value
About This Home
This home is located at 1629 Nc 126 None Unit 1, Morganton, NC 28655 and is currently estimated at $333,738, approximately $148 per square foot. 1629 Nc 126 None Unit 1 is a home located in Burke County with nearby schools including Oak Hill Elementary School, Table Rock Middle School, and Freedom High School.
Ownership History
Date
Name
Owned For
Owner Type
Purchase Details
Closed on
Jun 11, 2019
Sold by
Cook Carver Alan Neal and Cook Carver Wilma
Bought by
Hilbert Glenn Edward
Current Estimated Value
Purchase Details
Closed on
Aug 3, 2018
Sold by
Branch Banking And Trust Company
Bought by
Carver Alan Neal and Carver Wilma Cook
Purchase Details
Closed on
Feb 16, 2018
Sold by
Secretay Of Housing And Urbajn Devlpmeln
Bought by
Branch Bakking And Trust Comapny
Purchase Details
Closed on
Sep 22, 2017
Sold by
Branch Banking & Trust Company
Bought by
Secretary Of Housing & Urban Development
Purchase Details
Closed on
Sep 13, 2017
Sold by
Guinn Dannie
Bought by
Branch Banking & Trust Company
Purchase Details
Closed on
May 12, 2009
Sold by
Harbison Laverne and Robinson Irma L
Bought by
American General Financial Services Inc
Create a Home Valuation Report for This Property
The Home Valuation Report is an in-depth analysis detailing your home's value as well as a comparison with similar homes in the area
Home Values in the Area
Average Home Value in this Area
Purchase History
| Date | Buyer | Sale Price | Title Company |
|---|---|---|---|
| Hilbert Glenn Edward | $190,000 | None Available | |
| Carver Alan Neal | $82,000 | None Available | |
| Branch Bakking And Trust Comapny | -- | None Available | |
| Secretary Of Housing & Urban Development | -- | Attorney | |
| Branch Banking & Trust Company | $106,718 | Attorney | |
| American General Financial Services Inc | $80,800 | None Available |
Source: Public Records
Tax History
| Year | Tax Paid | Tax Assessment Tax Assessment Total Assessment is a certain percentage of the fair market value that is determined by local assessors to be the total taxable value of land and additions on the property. | Land | Improvement |
|---|---|---|---|---|
| 2025 | $1,825 | $272,969 | $10,923 | $262,046 |
| 2024 | $1,835 | $272,969 | $10,923 | $262,046 |
| 2023 | $1,835 | $272,969 | $10,923 | $262,046 |
| 2022 | $1,738 | $210,951 | $8,242 | $202,709 |
| 2021 | $1,732 | $210,951 | $8,242 | $202,709 |
| 2020 | $1,728 | $210,951 | $8,242 | $202,709 |
| 2019 | $1,082 | $128,714 | $8,242 | $120,472 |
| 2018 | $1,024 | $121,329 | $8,242 | $113,087 |
| 2017 | $1,028 | $121,990 | $8,242 | $113,748 |
| 2016 | $1,004 | $121,990 | $8,242 | $113,748 |
| 2015 | $1,001 | $121,990 | $8,242 | $113,748 |
| 2014 | $1,000 | $121,990 | $8,242 | $113,748 |
| 2013 | $988 | $121,990 | $8,242 | $113,748 |
Source: Public Records
Map
Nearby Homes
- 1629 Nc 126
- 2151 River Bend Ln
- 2086 Paddock Cir
- 2040 River Bend Ln
- 260 Forest Glen Way
- 109 Doe Run
- 1227 River Club Dr
- 210 S River Glen Dr
- 144 River Breeze Dr
- 2482 Paddock Cir
- 2937 Frank Whisnant Rd
- 1119 Greene Ct Unit 37
- 1113 Greene Ct Unit 36
- 1077 Greene Ct Unit 34
- 113 N Park Dr Unit 11 & 12
- 0 N Park Dr Unit 6
- 0 N Park Dr Unit 7
- 109 Turkey Tail Ln Unit 8 & 10
- 3026 Coventry Dr
- 2556 Nc 126
- 1629 Nc 126
- 1629 Nc 126 None
- 1629 Hwy 126
- 1595 Nc 126
- 1594 Nc 126
- 1664 N Carolina 126
- 1664 Nc 126
- 1590 Nc 126 None
- a portion of 1590 Nc 126 None
- a portion of Nc 126 None
- 1590 Nc 126 Unit 1594
- 1885 Watermill Rd
- 1871 Watermill Rd
- 1540 Nc 126
- 1855 Watermill Rd
- 1828 Watermill Rd
- 1831 Watermill Rd Unit 21
- 1522 Nc 126
- 1817 Watermill Rd
- 1760 Peaceful Ln
Your Personal Tour Guide
Ask me questions while you tour the home.