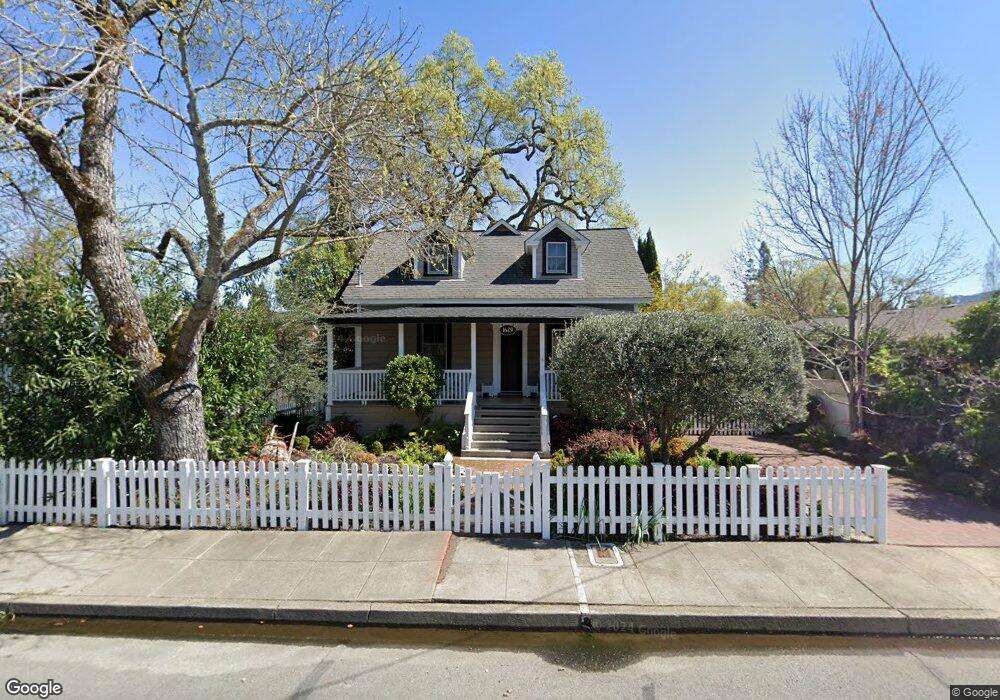
1629 Tainter St Saint Helena, CA 94574
Estimated Value: $1,847,850 - $2,541,000
4
Beds
3
Baths
2,262
Sq Ft
$972/Sq Ft
Est. Value
About This Home
This home is located at 1629 Tainter St, Saint Helena, CA 94574 and is currently estimated at $2,199,213, approximately $972 per square foot. 1629 Tainter St is a home located in Napa County with nearby schools including Saint Helena Elementary School, Saint Helena Primary School, and Robert Louis Stevenson Intermediate School.
Ownership History
Date
Name
Owned For
Owner Type
Purchase Details
Closed on
Aug 5, 2013
Sold by
Neumann Mechthild Michele and The Mechthild Michele Neumann
Bought by
Lozano Smith T P and Lozano Smith Diana
Current Estimated Value
Purchase Details
Closed on
Sep 22, 2004
Sold by
Neumann Mechthild Michelle
Bought by
Neumann Mechthild Michele and Mechthild Michele Neumann Trus
Purchase Details
Closed on
Sep 16, 2003
Sold by
Hudson David and Hudson Judith L M
Bought by
Neumann Mechthild Michele
Purchase Details
Closed on
Feb 24, 2003
Sold by
Hudson David and Hudson Judith L M
Bought by
Hudson David and Hudson Judith L M
Home Financials for this Owner
Home Financials are based on the most recent Mortgage that was taken out on this home.
Original Mortgage
$553,000
Interest Rate
5.85%
Purchase Details
Closed on
Sep 23, 2002
Sold by
Hudson David and Hudson Judith L
Bought by
Hudson David and Hudson Judith L M
Create a Home Valuation Report for This Property
The Home Valuation Report is an in-depth analysis detailing your home's value as well as a comparison with similar homes in the area
Home Values in the Area
Average Home Value in this Area
Purchase History
| Date | Buyer | Sale Price | Title Company |
|---|---|---|---|
| Lozano Smith T P | $1,225,000 | North American Title Company | |
| Neumann Mechthild Michele | -- | -- | |
| Neumann Mechthild Michele | $885,000 | Fidelity National Title Co | |
| Hudson David | -- | First American Title Company | |
| Hudson David | -- | First American Title Company | |
| Hudson David | -- | -- |
Source: Public Records
Mortgage History
| Date | Status | Borrower | Loan Amount |
|---|---|---|---|
| Previous Owner | Hudson David | $553,000 |
Source: Public Records
Tax History Compared to Growth
Tax History
| Year | Tax Paid | Tax Assessment Tax Assessment Total Assessment is a certain percentage of the fair market value that is determined by local assessors to be the total taxable value of land and additions on the property. | Land | Improvement |
|---|---|---|---|---|
| 2025 | $15,700 | $1,501,674 | $643,574 | $858,100 |
| 2024 | $15,700 | $1,472,230 | $630,955 | $841,275 |
| 2023 | $15,700 | $1,443,364 | $618,584 | $824,780 |
| 2022 | $14,914 | $1,415,063 | $606,455 | $808,608 |
| 2021 | $14,719 | $1,387,317 | $594,564 | $792,753 |
| 2020 | $14,573 | $1,373,093 | $588,468 | $784,625 |
| 2019 | $14,320 | $1,346,171 | $576,930 | $769,241 |
| 2018 | $14,089 | $1,319,776 | $565,618 | $754,158 |
| 2017 | $13,826 | $1,293,899 | $554,528 | $739,371 |
| 2016 | $13,528 | $1,268,529 | $543,655 | $724,874 |
| 2015 | $13,424 | $1,249,475 | $535,489 | $713,986 |
| 2014 | $13,299 | $1,225,000 | $525,000 | $700,000 |
Source: Public Records
Map
Nearby Homes
- 1243 Stockton St
- 1209 Stockton St
- 1664 Spring St
- 1503 Tainter St
- 1551 Spring St
- 1711 Tainter St
- 1233 Kearney St
- 1711 Spring St
- 1430 Wallis Ct
- 1430 Stockton St
- 1777 Adams St
- 1133 Oak Ave
- 1123 Oak Ave
- 1467 Kearney St
- 1540 Allyn Ave
- 1547 Allyn Ave
- 1191 Hudson Ave
- 1540 Madrona Ave
- 1330 Pine St
- 1881 Madrona Ave
- 1639 Tainter St
- 1611 Tainter St
- 1651 Tainter St
- 1257 Stockton St
- 1626 Tainter St
- 1616 Tainter St
- 1642 Tainter St
- 1227 Stockton St
- 1670 Spring St
- 1305 Stockton St
- 1709 Tainter St
- 1660 Spring St
- 1219 Stockton St
- 1656 Tainter St
- 1213 Stockton St
- 1626 Spring St
- 1321 Stockton St
- 1256 Stockton St
- 1248 Stockton St
- 1240 Stockton St