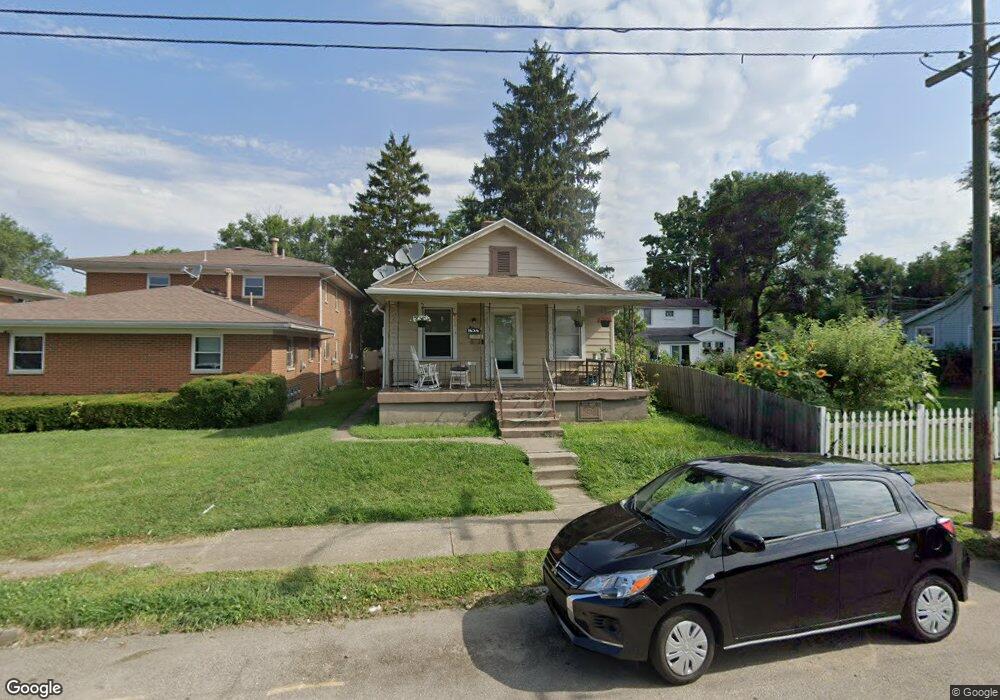
1629 Tuttle Ave Dayton, OH 45403
Eastern Hills NeighborhoodEstimated Value: $78,000 - $112,000
2
Beds
1
Bath
852
Sq Ft
$113/Sq Ft
Est. Value
About This Home
This home is located at 1629 Tuttle Ave, Dayton, OH 45403 and is currently estimated at $96,132, approximately $112 per square foot. 1629 Tuttle Ave is a home located in Montgomery County with nearby schools including Cleveland Elementary School, Eastmont Elementary, and Horace Mann Elementary School.
Ownership History
Date
Name
Owned For
Owner Type
Purchase Details
Closed on
Aug 12, 2015
Sold by
Kincaid Brandy L
Bought by
Winningham Rick and Winningham Rhonda
Current Estimated Value
Purchase Details
Closed on
Jul 5, 2011
Sold by
Baldwin June and Baldwin David W
Bought by
Federal National Mortgage Association
Purchase Details
Closed on
Jul 2, 2007
Sold by
Baldwin Richard A
Bought by
Baldwin June and Baldwin David W
Purchase Details
Closed on
Oct 7, 2004
Sold by
Baldwin David W and Baldwin June
Bought by
Baldwin June and Baldwin Richard A
Purchase Details
Closed on
Jul 30, 2004
Sold by
Holzfaster Byron E
Bought by
Baldwin June
Home Financials for this Owner
Home Financials are based on the most recent Mortgage that was taken out on this home.
Original Mortgage
$27,500
Interest Rate
6.34%
Mortgage Type
Fannie Mae Freddie Mac
Create a Home Valuation Report for This Property
The Home Valuation Report is an in-depth analysis detailing your home's value as well as a comparison with similar homes in the area
Home Values in the Area
Average Home Value in this Area
Purchase History
| Date | Buyer | Sale Price | Title Company |
|---|---|---|---|
| Winningham Rick | $8,300 | Attorney | |
| Federal National Mortgage Association | $20,000 | None Available | |
| Baldwin June | -- | Attorney | |
| Baldwin June | -- | None Available | |
| Baldwin June | $45,000 | -- |
Source: Public Records
Mortgage History
| Date | Status | Borrower | Loan Amount |
|---|---|---|---|
| Previous Owner | Baldwin June | $27,500 |
Source: Public Records
Tax History Compared to Growth
Tax History
| Year | Tax Paid | Tax Assessment Tax Assessment Total Assessment is a certain percentage of the fair market value that is determined by local assessors to be the total taxable value of land and additions on the property. | Land | Improvement |
|---|---|---|---|---|
| 2024 | $1,377 | $24,400 | $4,520 | $19,880 |
| 2023 | $1,377 | $24,400 | $4,520 | $19,880 |
| 2022 | $1,327 | $18,180 | $3,370 | $14,810 |
| 2021 | $1,320 | $18,180 | $3,370 | $14,810 |
| 2020 | $1,318 | $18,180 | $3,370 | $14,810 |
| 2019 | $1,203 | $14,910 | $3,370 | $11,540 |
| 2018 | $1,205 | $14,910 | $3,370 | $11,540 |
| 2017 | $1,196 | $14,910 | $3,370 | $11,540 |
| 2016 | $1,281 | $15,210 | $3,370 | $11,840 |
| 2015 | $1,211 | $15,210 | $3,370 | $11,840 |
| 2014 | $1,211 | $15,210 | $3,370 | $11,840 |
| 2012 | -- | $15,950 | $5,250 | $10,700 |
Source: Public Records
Map
Nearby Homes
- 1620 Gondert Ave Unit 1618
- 1620 Gondert Ave
- 1714 Gondert Ave
- 1732 Gummer Ave
- 1700 Suman Ave
- 1759 Gondert Ave
- 1614 Huffman Ave Unit 1612
- 763 Greenlawn Ave
- 520 S Smithville Rd
- 515 Heiss Ave Unit 515-517
- 920 Shedborne Ave
- 1815 Huffman Ave
- 404 S Smithville Rd
- 1601 Speice Ave
- 521 Pollock Rd
- 1345 Jordan Ave
- 3200 Linden Ave
- 601 Ostrander Dr
- 3125 Wellington Dr
- 1921 Emerald Ct
- 1625 Tuttle Ave
- 1639 Tuttle Ave
- 1619 Tuttle Ave
- 1641 Tuttle Ave
- 1647 Tuttle Ave
- 1615 Tuttle Ave
- 1628 Gondert Ave
- 1634 Gondert Ave
- 1626 Gondert Ave
- 1638 Gondert Ave
- 1649 Tuttle Ave
- 1618 Gondert Ave
- 1614 Gondert Ave
- 1655 Tuttle Ave
- 1650 Gondert Ave
- 1603 Tuttle Ave
- 1659 Tuttle Ave
- 1654 Gondert Ave
- 1661 Tuttle Ave
- 1661 Tuttle Ave Unit A