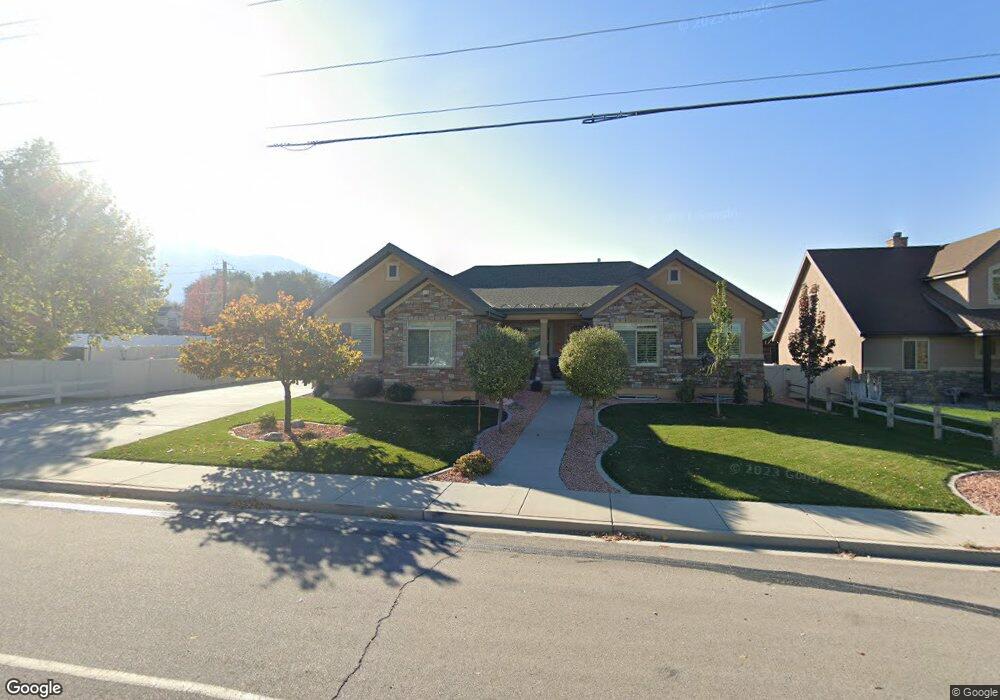
1629 W 1600 N Mapleton, UT 84664
Estimated Value: $636,000 - $847,283
3
Beds
3
Baths
1,960
Sq Ft
$387/Sq Ft
Est. Value
About This Home
This home is located at 1629 W 1600 N, Mapleton, UT 84664 and is currently estimated at $758,821, approximately $387 per square foot. 1629 W 1600 N is a home with nearby schools including Mapleton School, Mapleton Junior High School, and Maple Mountain High School.
Ownership History
Date
Name
Owned For
Owner Type
Purchase Details
Closed on
Jun 11, 2014
Sold by
Schwitzer Carl and Schwitzer Marie
Bought by
Schwitzer Carl and Schwitzer Marie
Current Estimated Value
Home Financials for this Owner
Home Financials are based on the most recent Mortgage that was taken out on this home.
Original Mortgage
$260,000
Outstanding Balance
$200,792
Interest Rate
4.25%
Mortgage Type
Construction
Estimated Equity
$558,029
Purchase Details
Closed on
Mar 13, 2014
Sold by
Seader James Robert and Seader Ellen M
Bought by
Schwitzer Carl and Schwitzer Marie
Purchase Details
Closed on
Nov 1, 2004
Sold by
Simpson David R
Bought by
Foster Warren E and Foster Debra A
Home Financials for this Owner
Home Financials are based on the most recent Mortgage that was taken out on this home.
Original Mortgage
$91,114
Interest Rate
5.74%
Mortgage Type
Purchase Money Mortgage
Create a Home Valuation Report for This Property
The Home Valuation Report is an in-depth analysis detailing your home's value as well as a comparison with similar homes in the area
Home Values in the Area
Average Home Value in this Area
Purchase History
| Date | Buyer | Sale Price | Title Company |
|---|---|---|---|
| Schwitzer Carl | -- | North American Title | |
| Schwitzer Carl | -- | Access Title Co | |
| Foster Warren E | -- | Pro Title & Escrow Inc |
Source: Public Records
Mortgage History
| Date | Status | Borrower | Loan Amount |
|---|---|---|---|
| Open | Schwitzer Carl | $260,000 | |
| Previous Owner | Foster Warren E | $91,114 |
Source: Public Records
Tax History
| Year | Tax Paid | Tax Assessment Tax Assessment Total Assessment is a certain percentage of the fair market value that is determined by local assessors to be the total taxable value of land and additions on the property. | Land | Improvement |
|---|---|---|---|---|
| 2025 | $3,867 | $435,985 | -- | -- |
| 2024 | $3,867 | $378,840 | $0 | $0 |
| 2023 | $3,979 | $392,260 | $0 | $0 |
| 2022 | $3,816 | $371,965 | $0 | $0 |
| 2021 | $3,223 | $482,300 | $164,400 | $317,900 |
| 2020 | $3,201 | $463,400 | $145,500 | $317,900 |
| 2019 | $2,815 | $416,000 | $139,600 | $276,400 |
| 2018 | $2,635 | $370,600 | $117,600 | $253,000 |
| 2017 | $2,676 | $199,760 | $0 | $0 |
| 2016 | $2,638 | $195,745 | $0 | $0 |
| 2015 | $2,547 | $187,880 | $0 | $0 |
| 2014 | $1,218 | $88,200 | $0 | $0 |
Source: Public Records
Map
Nearby Homes
- 1518 S 600 E
- 1403 S 625 E
- 1525 S 400 E Unit 36
- 1410 W 1200 N
- 1853 S 375 E
- 1121 W 1800 N
- 1836 W 800 N
- 1896 W 800 N
- 281 Winchester Dr
- 405 W 1200 N Unit 4
- 487 W 1200 N Unit 1
- 683 N Heritage St
- 657 N Heritage St Unit 9
- 641 N Heritage St Unit 8
- 1632 S Main St
- 599 N Heritage St Unit 6
- 2128 Bridger Dr
- 581 N Heritage St Unit 5
- 1512 W 600 N Unit 4
- 1446 W 600 N Unit 5
- 1802 W 1600 N Unit 4
- 1804 W 1600 N
- 1806 W 1600 N
- 1811 W 1600 N Unit 11
- 1814 W 1600 N
- 1824 W 1600 N Unit 24
- 1605 W 1600 N
- 1651 W 1600 N
- 1555 N 1600 W
- 1630 N 1650 W
- 1675 W 1600 N
- 1501 N 1600 W
- 1635 N 1600 W
- 1625 N 1650 W
- 1595 W 1600 N
- 1477 N 1600 W
- 607 E 1600 S
- 607 E 1650 S
- 1755 W 1600 N
- 1630 N 1600 W
Your Personal Tour Guide
Ask me questions while you tour the home.