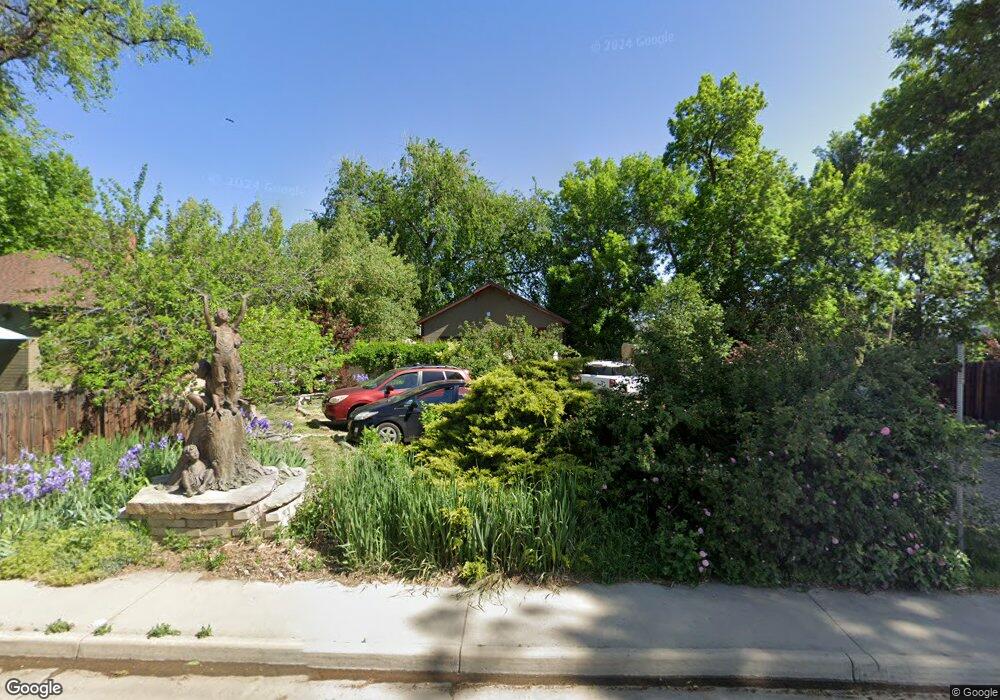
1629 W 8th St Loveland, CO 80537
Estimated Value: $354,000 - $440,000
1
Bed
1
Bath
2,506
Sq Ft
$157/Sq Ft
Est. Value
About This Home
This home is located at 1629 W 8th St, Loveland, CO 80537 and is currently estimated at $394,605, approximately $157 per square foot. 1629 W 8th St is a home located in Larimer County with nearby schools including Garfield Elementary School, Bill Reed Middle School, and Loveland High School.
Ownership History
Date
Name
Owned For
Owner Type
Purchase Details
Closed on
Apr 25, 2003
Sold by
Highland Properties 2502 Llc
Bought by
Dedecker Jane A
Current Estimated Value
Purchase Details
Closed on
Aug 7, 2002
Sold by
Almquist Marvin N and Almquist Virginia L
Bought by
Highland Properties 2502 Llc
Home Financials for this Owner
Home Financials are based on the most recent Mortgage that was taken out on this home.
Original Mortgage
$275,000
Interest Rate
6.53%
Purchase Details
Closed on
May 14, 1999
Sold by
Almquist Marvin N Virginia L
Bought by
Almquist Marvin N and Almquist Virginia L
Purchase Details
Closed on
Jun 14, 1996
Sold by
G L Hoff Company
Bought by
Almquist Marvin N and Almquist Virginia L
Home Financials for this Owner
Home Financials are based on the most recent Mortgage that was taken out on this home.
Original Mortgage
$105,000
Interest Rate
7.99%
Create a Home Valuation Report for This Property
The Home Valuation Report is an in-depth analysis detailing your home's value as well as a comparison with similar homes in the area
Home Values in the Area
Average Home Value in this Area
Purchase History
| Date | Buyer | Sale Price | Title Company |
|---|---|---|---|
| Dedecker Jane A | $280,000 | -- | |
| Highland Properties 2502 Llc | $280,000 | North American Title Co | |
| Almquist Marvin N | -- | -- | |
| Almquist Marvin N | $140,000 | -- | |
| G L Hoff Company | -- | -- |
Source: Public Records
Mortgage History
| Date | Status | Borrower | Loan Amount |
|---|---|---|---|
| Previous Owner | Highland Properties 2502 Llc | $275,000 | |
| Previous Owner | Almquist Marvin N | $105,000 |
Source: Public Records
Tax History Compared to Growth
Tax History
| Year | Tax Paid | Tax Assessment Tax Assessment Total Assessment is a certain percentage of the fair market value that is determined by local assessors to be the total taxable value of land and additions on the property. | Land | Improvement |
|---|---|---|---|---|
| 2025 | $3,231 | $52,543 | $23,454 | $29,089 |
| 2024 | $3,116 | $52,543 | $23,454 | $29,089 |
| 2022 | $3,990 | $50,141 | $19,921 | $30,220 |
| 2021 | $4,028 | $50,682 | $20,246 | $30,436 |
| 2020 | $4,505 | $56,659 | $6,746 | $49,913 |
| 2019 | $4,429 | $56,659 | $6,746 | $49,913 |
| 2018 | $4,001 | $48,611 | $6,773 | $41,838 |
| 2017 | $3,445 | $48,611 | $6,773 | $41,838 |
| 2016 | $3,062 | $41,753 | $7,185 | $34,568 |
| 2015 | $3,037 | $41,750 | $7,180 | $34,570 |
| 2014 | $2,526 | $33,590 | $10,890 | $22,700 |
Source: Public Records
Map
Nearby Homes
- 1714 W 8th St
- 1658 Taft Gardens Cir
- 1667 Taft Gardens Cir
- 901 W Kelly Dr
- 1404 W 6th St
- 1330 W 6th St
- 1100 Taft Ave Unit 46
- 1100 Taft Ave
- 1100 N Taft Ave Unit 27
- 1205 Loch Mount Dr
- 1725 Keyes Ct
- 1209 E Broadmoor Dr
- 1125 W Broadmoor Dr
- 1607 W U S 34
- 914 W 6th St
- 1131 W Broadmoor Dr
- 1016 Winona Cir
- 610 California Ave
- 1502 Westshore Dr
- 680 Colorado Ave
- 1705 W 8th St
- 810 E Kelly Dr
- 1503 W 8th St
- 814 E Kelly Dr
- 803 E Kelly Dr
- 807 E Kelly Dr
- 822 E Kelly Dr
- 1650 W 8th St
- 811 E Kelly Dr
- 1704 W 8th St
- 1408 W 8th St
- 815 E Kelly Dr
- 904 E Kelly Dr
- 1721 W 8th St
- 1631 Taft Gardens Cir
- 1640 Taft Gardens Cir
- 819 E Kelly Dr
- 1702 W 8th St
- 808 Litle Ct
- 908 E Kelly Dr