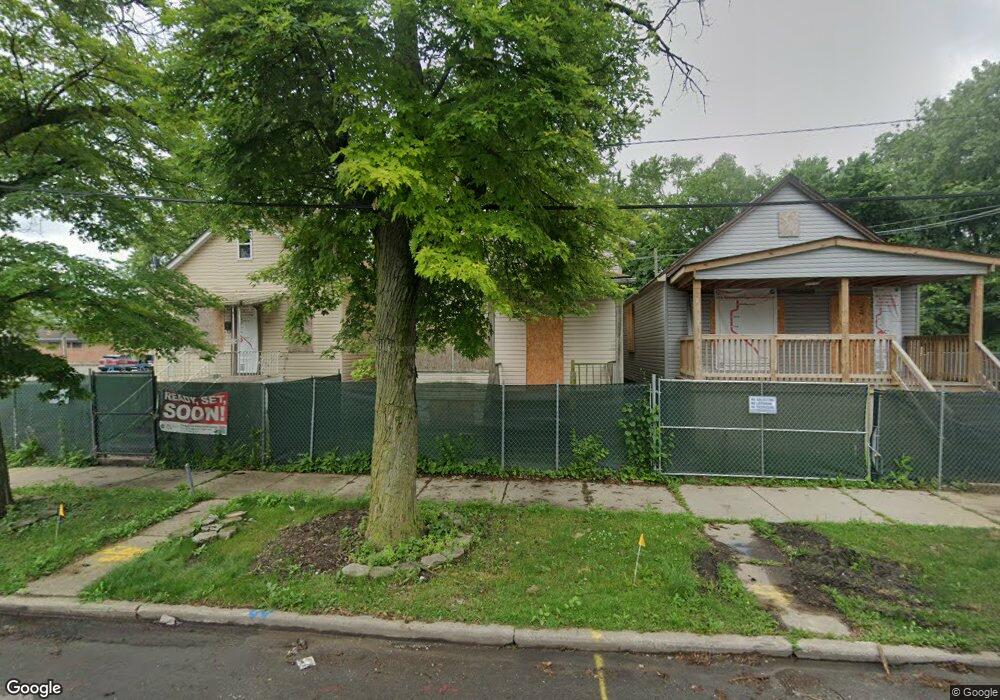
163 E 116th St Chicago, IL 60628
West Pullman NeighborhoodEstimated Value: $182,000
6
Beds
2
Baths
1,386
Sq Ft
$131/Sq Ft
Est. Value
About This Home
This home is located at 163 E 116th St, Chicago, IL 60628 and is currently priced at $182,000, approximately $131 per square foot. 163 E 116th St is a home located in Cook County with nearby schools including Curtis Elementary School, Corliss High School, and CICS Prairie.
Ownership History
Date
Name
Owned For
Owner Type
Purchase Details
Closed on
Mar 26, 2024
Sold by
Cook County Land Bk Authority and County Of Cook
Bought by
Chicago Transit Authority
Current Estimated Value
Purchase Details
Closed on
Sep 24, 2021
Sold by
County Of Cook
Bought by
County Of Cook and Cook County Land Bank Authority
Purchase Details
Closed on
Jun 24, 2009
Sold by
Vericrest Financial Inc
Bought by
Gakhal Paul
Purchase Details
Closed on
Aug 31, 2006
Sold by
Alexander Wanda
Bought by
The Cit Group/Consumer Finance Inc
Purchase Details
Closed on
Jun 15, 2004
Sold by
Suburban Bank & Trust Co
Bought by
Alexander Wanda
Home Financials for this Owner
Home Financials are based on the most recent Mortgage that was taken out on this home.
Original Mortgage
$128,250
Interest Rate
8.97%
Mortgage Type
Commercial
Purchase Details
Closed on
Apr 4, 2001
Sold by
Barry Wilhelminia
Bought by
Suburban Bank & Trust Company and Trust #1-1737
Create a Home Valuation Report for This Property
The Home Valuation Report is an in-depth analysis detailing your home's value as well as a comparison with similar homes in the area
Home Values in the Area
Average Home Value in this Area
Purchase History
| Date | Buyer | Sale Price | Title Company |
|---|---|---|---|
| Chicago Transit Authority | -- | None Listed On Document | |
| County Of Cook | -- | None Available | |
| Gakhal Paul | $8,500 | Richmond Title Services | |
| The Cit Group/Consumer Finance Inc | -- | None Available | |
| Alexander Wanda | $135,000 | Title Professionals Of Ameri | |
| Suburban Bank & Trust Company | $35,000 | Lawyers Title Insurance Corp |
Source: Public Records
Mortgage History
| Date | Status | Borrower | Loan Amount |
|---|---|---|---|
| Previous Owner | Alexander Wanda | $128,250 |
Source: Public Records
Tax History
| Year | Tax Paid | Tax Assessment Tax Assessment Total Assessment is a certain percentage of the fair market value that is determined by local assessors to be the total taxable value of land and additions on the property. | Land | Improvement |
|---|---|---|---|---|
| 2025 | $907 | -- | -- | -- |
| 2024 | $907 | -- | -- | -- |
| 2023 | $907 | -- | -- | -- |
| 2022 | $907 | -- | -- | -- |
| 2021 | $907 | $4,499 | $3,538 | $961 |
| 2020 | $1,698 | $7,604 | $2,421 | $5,183 |
| 2019 | $1,761 | $8,741 | $2,421 | $6,320 |
| 2018 | $1,731 | $8,741 | $2,421 | $6,320 |
| 2017 | $2,775 | $12,864 | $2,235 | $10,629 |
| 2016 | $2,583 | $12,864 | $2,235 | $10,629 |
| 2015 | $2,363 | $12,864 | $2,235 | $10,629 |
| 2014 | $2,047 | $11,007 | $1,862 | $9,145 |
| 2013 | $2,007 | $11,007 | $1,862 | $9,145 |
Source: Public Records
Map
Nearby Homes
- 129 E Kensington Ave
- 11611 S Michigan Ave
- 321 E Kensington Ave
- 11735 S Indiana Ave
- 140 E 118th St
- 344 E 117th St
- 25 E 117th Place
- 11833 S Indiana Ave
- 11440 S Indiana Ave
- 147 E 118th Place
- 11442 S Prairie Ave
- 11576 S State St
- 11431 S Indiana Ave
- 391 E Kensington Ave
- 11548 S State St
- 11581 S Lafayette Ave
- 11709 S Lafayette Ave
- 16 E 118th Place
- 11825 S State St
- 143 E 119th St
Your Personal Tour Guide
Ask me questions while you tour the home.