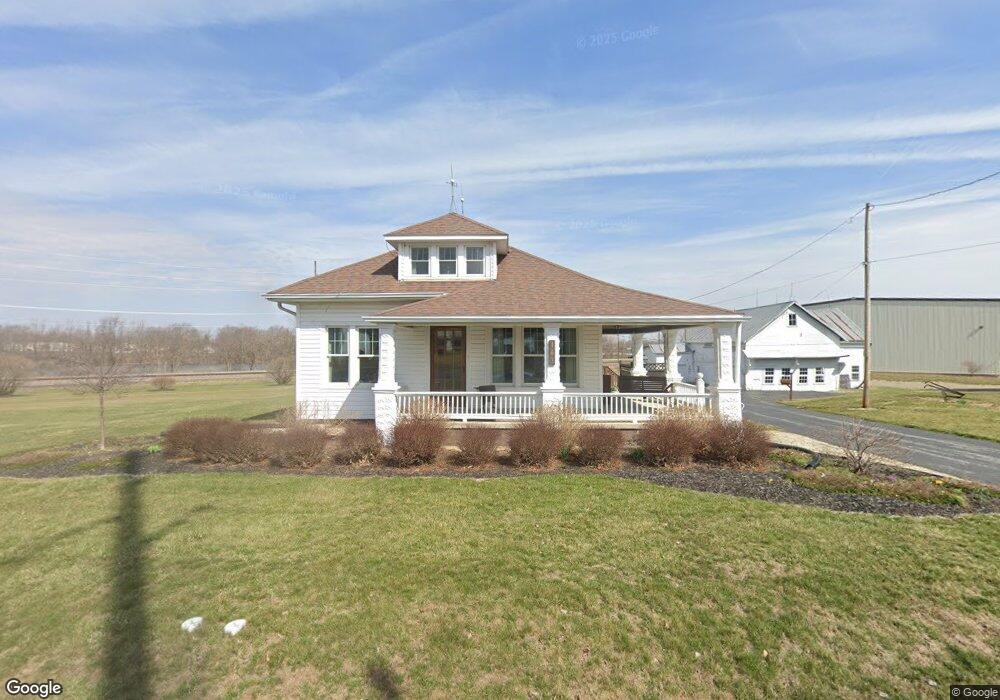
163 E Jefferson St Bluffton, OH 45817
Estimated Value: $247,000 - $295,000
4
Beds
1
Bath
1,712
Sq Ft
$161/Sq Ft
Est. Value
About This Home
This home is located at 163 E Jefferson St, Bluffton, OH 45817 and is currently estimated at $276,185, approximately $161 per square foot. 163 E Jefferson St is a home located in Allen County with nearby schools including Bluffton Elementary School, Bluffton Middle School, and Bluffton High School.
Ownership History
Date
Name
Owned For
Owner Type
Purchase Details
Closed on
Oct 8, 2015
Sold by
Dunifon Ann J
Bought by
Btms Investments Llc
Current Estimated Value
Home Financials for this Owner
Home Financials are based on the most recent Mortgage that was taken out on this home.
Original Mortgage
$800,000
Interest Rate
3.88%
Mortgage Type
Future Advance Clause Open End Mortgage
Purchase Details
Closed on
Jan 1, 1990
Bought by
Basinger Irene
Create a Home Valuation Report for This Property
The Home Valuation Report is an in-depth analysis detailing your home's value as well as a comparison with similar homes in the area
Home Values in the Area
Average Home Value in this Area
Purchase History
| Date | Buyer | Sale Price | Title Company |
|---|---|---|---|
| Btms Investments Llc | $145,000 | None Available | |
| Basinger Irene | -- | -- |
Source: Public Records
Mortgage History
| Date | Status | Borrower | Loan Amount |
|---|---|---|---|
| Closed | Btms Investments Llc | $800,000 |
Source: Public Records
Tax History
| Year | Tax Paid | Tax Assessment Tax Assessment Total Assessment is a certain percentage of the fair market value that is determined by local assessors to be the total taxable value of land and additions on the property. | Land | Improvement |
|---|---|---|---|---|
| 2024 | $3,063 | $80,120 | $21,980 | $58,140 |
| 2023 | $2,572 | $60,870 | $18,310 | $42,560 |
| 2022 | $2,595 | $60,870 | $18,310 | $42,560 |
| 2021 | $2,262 | $60,870 | $18,310 | $42,560 |
| 2020 | $1,949 | $47,390 | $14,840 | $32,550 |
| 2019 | $1,949 | $47,390 | $14,840 | $32,550 |
| 2018 | $1,956 | $47,390 | $14,840 | $32,550 |
| 2017 | $1,733 | $41,970 | $14,840 | $27,130 |
| 2016 | $1,744 | $41,970 | $14,840 | $27,130 |
| 2015 | $1,085 | $41,970 | $14,840 | $27,130 |
| 2014 | $1,085 | $34,590 | $14,390 | $20,200 |
| 2013 | $1,002 | $34,590 | $14,390 | $20,200 |
Source: Public Records
Map
Nearby Homes
- 328 N Main St
- 0 Ohio 103
- 408 Cherry St
- 106 Riley St
- 210 N Jackson St
- 222 N Lawn Ave
- 307 S Main St Unit back
- 218 S Jackson St
- 217 Grove St
- 513 S Jackson St
- 301 Parkview Dr
- 303 Parkview Dr
- 305 Parkview Dr
- 307 Parkview Dr
- 160 Chestnut Ln
- 315 Parkview Dr
- 317 Parkview Dr
- 319 Parkview Dr
- 110 Magnolia Ln
- 0 Columbus Grove-Bluffton Rd
- 160 E Jefferson St
- 172 E Jefferson St
- 156 E Jefferson St
- 176 E Jefferson St
- 154 E Jefferson St
- 180 E Jefferson St
- 182 E Jefferson St
- 169 E Elm St
- 211 Huber St
- 165 E Elm St
- 173 E Elm St
- 208 Huber St
- 201 E Elm St
- 190 E Jefferson St
- 209 Huber St
- 209 E Elm St
- 211 E Elm St
- 194 E Jefferson St
- 168 E Elm St
- 174 E Elm St
Your Personal Tour Guide
Ask me questions while you tour the home.