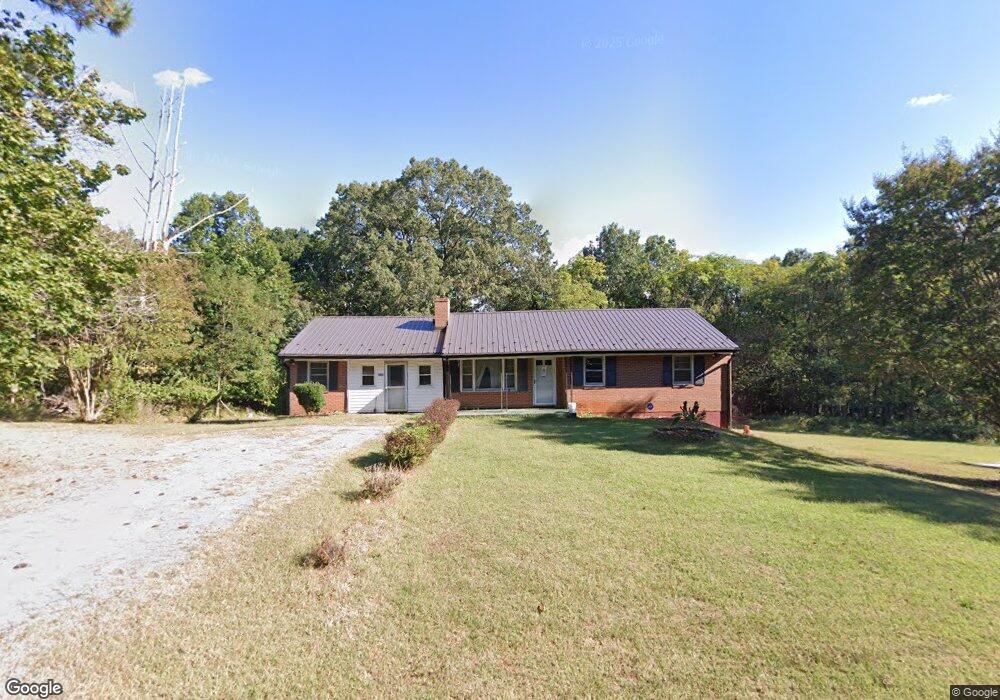
163 E Perch Rd Monroe, VA 24574
Estimated Value: $152,293 - $171,000
2
Beds
1
Bath
1,086
Sq Ft
$149/Sq Ft
Est. Value
About This Home
This home is located at 163 E Perch Rd, Monroe, VA 24574 and is currently estimated at $161,647, approximately $148 per square foot. 163 E Perch Rd is a home located in Amherst County with nearby schools including Pleasant View Elementary School, Monelison Middle School, and Amherst County High School.
Ownership History
Date
Name
Owned For
Owner Type
Purchase Details
Closed on
Jun 20, 2025
Sold by
Woodruff Mary E
Bought by
Tardy Adrian
Current Estimated Value
Home Financials for this Owner
Home Financials are based on the most recent Mortgage that was taken out on this home.
Original Mortgage
$110,000
Outstanding Balance
$109,229
Interest Rate
6.76%
Mortgage Type
New Conventional
Estimated Equity
$52,418
Create a Home Valuation Report for This Property
The Home Valuation Report is an in-depth analysis detailing your home's value as well as a comparison with similar homes in the area
Purchase History
| Date | Buyer | Sale Price | Title Company |
|---|---|---|---|
| Tardy Adrian | $120,000 | None Listed On Document |
Source: Public Records
Mortgage History
| Date | Status | Borrower | Loan Amount |
|---|---|---|---|
| Open | Tardy Adrian | $110,000 |
Source: Public Records
Tax History
| Year | Tax Paid | Tax Assessment Tax Assessment Total Assessment is a certain percentage of the fair market value that is determined by local assessors to be the total taxable value of land and additions on the property. | Land | Improvement |
|---|---|---|---|---|
| 2026 | $978 | $160,400 | $30,000 | $130,400 |
| 2025 | $805 | $132,000 | $25,000 | $107,000 |
| 2024 | $805 | $132,000 | $25,000 | $107,000 |
| 2023 | $805 | $132,000 | $25,000 | $107,000 |
| 2022 | $805 | $132,000 | $25,000 | $107,000 |
| 2021 | $805 | $132,000 | $25,000 | $107,000 |
| 2020 | $805 | $132,000 | $25,000 | $107,000 |
| 2019 | $805 | $131,900 | $31,000 | $100,900 |
| 2018 | $805 | $131,900 | $31,000 | $100,900 |
| 2017 | $805 | $131,900 | $31,000 | $100,900 |
| 2016 | $805 | $131,900 | $31,000 | $100,900 |
| 2015 | $739 | $131,900 | $31,000 | $100,900 |
| 2014 | $739 | $131,900 | $31,000 | $100,900 |
Source: Public Records
Map
Nearby Homes
Your Personal Tour Guide
Ask me questions while you tour the home.