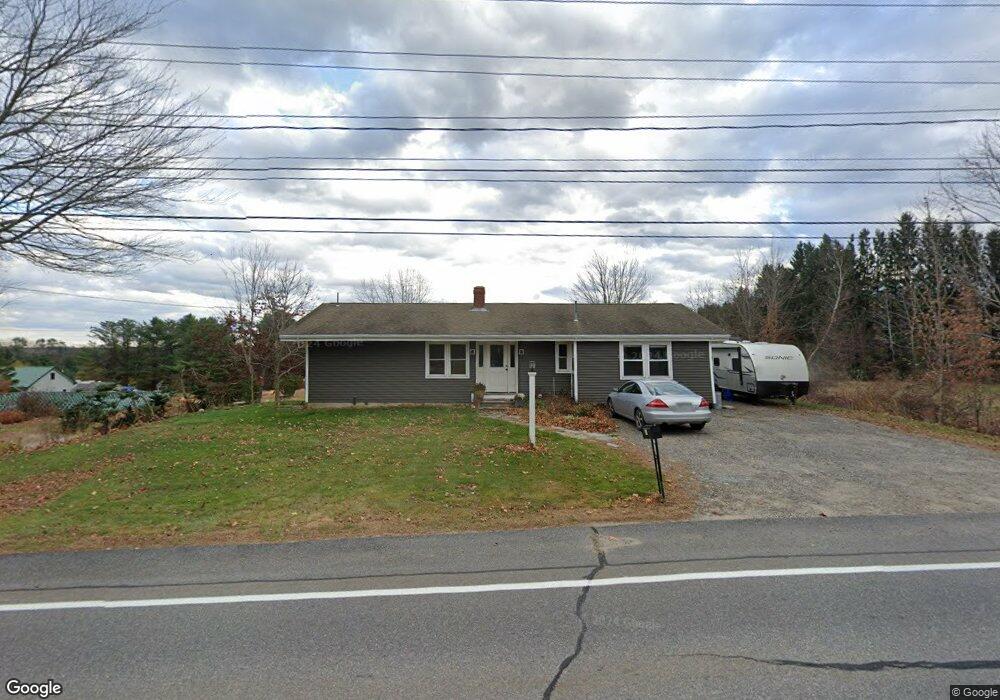
163 Huston Rd Gorham, ME 04038
Estimated Value: $401,000 - $469,000
3
Beds
2
Baths
1,386
Sq Ft
$307/Sq Ft
Est. Value
About This Home
This home is located at 163 Huston Rd, Gorham, ME 04038 and is currently estimated at $425,694, approximately $307 per square foot. 163 Huston Rd is a home located in Cumberland County with nearby schools including Great Falls Elementary School, Gorham Middle School, and Gorham High School.
Ownership History
Date
Name
Owned For
Owner Type
Purchase Details
Closed on
Jul 24, 2020
Sold by
Wells Deborah J
Bought by
Jeffords Alicia and Jeffords Tony
Current Estimated Value
Home Financials for this Owner
Home Financials are based on the most recent Mortgage that was taken out on this home.
Original Mortgage
$160,000
Outstanding Balance
$142,141
Interest Rate
3.2%
Mortgage Type
New Conventional
Estimated Equity
$283,553
Purchase Details
Closed on
Jan 3, 2013
Sold by
Waitt Winnifred E Est
Bought by
Wells Deborah J
Create a Home Valuation Report for This Property
The Home Valuation Report is an in-depth analysis detailing your home's value as well as a comparison with similar homes in the area
Home Values in the Area
Average Home Value in this Area
Purchase History
| Date | Buyer | Sale Price | Title Company |
|---|---|---|---|
| Jeffords Alicia | -- | None Available | |
| Wells Deborah J | -- | -- |
Source: Public Records
Mortgage History
| Date | Status | Borrower | Loan Amount |
|---|---|---|---|
| Open | Jeffords Alicia | $160,000 |
Source: Public Records
Tax History Compared to Growth
Tax History
| Year | Tax Paid | Tax Assessment Tax Assessment Total Assessment is a certain percentage of the fair market value that is determined by local assessors to be the total taxable value of land and additions on the property. | Land | Improvement |
|---|---|---|---|---|
| 2024 | $3,995 | $271,800 | $71,500 | $200,300 |
| 2023 | $3,737 | $271,800 | $71,500 | $200,300 |
| 2022 | $3,493 | $271,800 | $71,500 | $200,300 |
| 2021 | $2,813 | $145,000 | $53,700 | $91,300 |
| 2020 | $2,755 | $145,000 | $53,700 | $91,300 |
| 2019 | $2,748 | $145,000 | $53,700 | $91,300 |
| 2018 | $1,469 | $145,000 | $53,700 | $91,300 |
| 2017 | $2,480 | $145,000 | $53,700 | $91,300 |
| 2016 | $2,467 | $145,100 | $53,800 | $91,300 |
| 2015 | $2,365 | $145,100 | $53,800 | $91,300 |
| 2014 | $2,415 | $138,800 | $56,900 | $81,900 |
| 2013 | $2,401 | $138,800 | $56,900 | $81,900 |
Source: Public Records
Map
Nearby Homes
- 46 Sebago Lake Rd
- 256 Huston Rd
- 771 Gray Rd
- 209 Mosher Rd
- 50 Winslow Rd Unit B
- 18 Victoria Ln
- 0 Libby Ave
- 29 Victoria Ln
- 8 Wolf River Run
- 7 Trestle Way
- 1 Trestle Way
- 75 Mighty St
- 0 Meredith Dr
- 42 Barnes Rd
- 180 Highland Cliff Rd
- 1 Betty Ln
- TBD Fort Hill Rd
- 93 River Rd
- 180 Falcon Crest Dr Unit 55
- 182 Falcon Crest Dr Unit 56