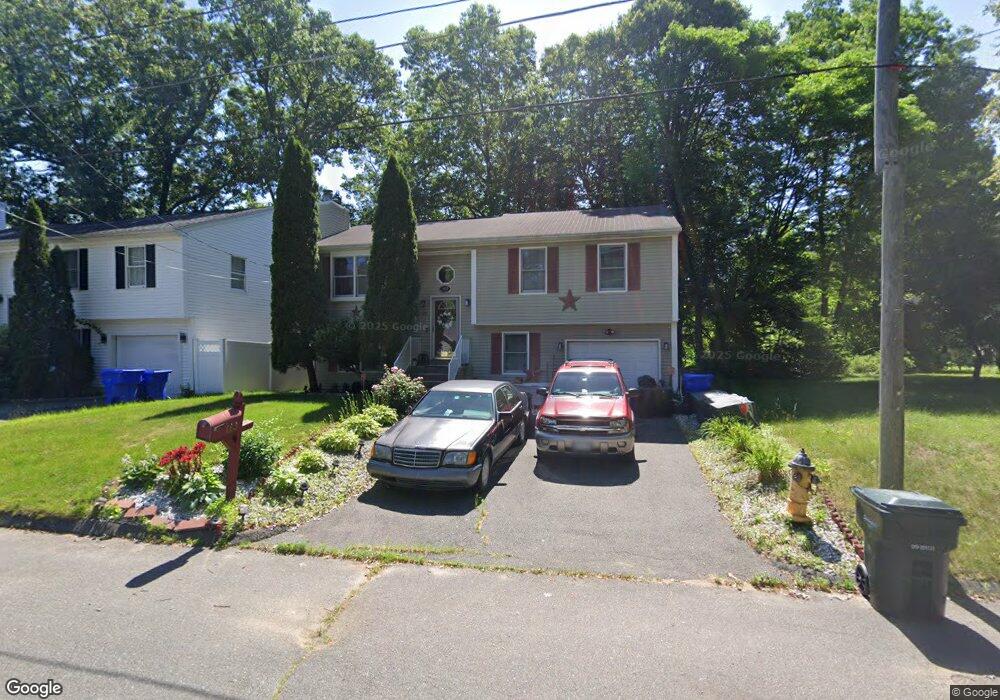
163 Jamaica St Springfield, MA 01119
Boston Road NeighborhoodEstimated Value: $276,000 - $329,000
3
Beds
2
Baths
1,112
Sq Ft
$279/Sq Ft
Est. Value
About This Home
This home is located at 163 Jamaica St, Springfield, MA 01119 and is currently estimated at $310,497, approximately $279 per square foot. 163 Jamaica St is a home located in Hampden County with nearby schools including Warner, M Marcus Kiley Middle, and Springfield Central High School.
Ownership History
Date
Name
Owned For
Owner Type
Purchase Details
Closed on
May 9, 2007
Sold by
Knight Cheryl
Bought by
Knight Cheryl
Current Estimated Value
Home Financials for this Owner
Home Financials are based on the most recent Mortgage that was taken out on this home.
Original Mortgage
$153,800
Outstanding Balance
$93,756
Interest Rate
6.21%
Mortgage Type
Purchase Money Mortgage
Estimated Equity
$216,741
Purchase Details
Closed on
Jun 11, 1996
Sold by
Torcia Michael A
Bought by
Blount Nathaniel
Home Financials for this Owner
Home Financials are based on the most recent Mortgage that was taken out on this home.
Original Mortgage
$89,500
Interest Rate
7.89%
Mortgage Type
Purchase Money Mortgage
Purchase Details
Closed on
Nov 29, 1995
Sold by
Murphy Joseph R and Murphy Kathleen M
Bought by
Torcia Richard J and Torcia Michael A
Create a Home Valuation Report for This Property
The Home Valuation Report is an in-depth analysis detailing your home's value as well as a comparison with similar homes in the area
Home Values in the Area
Average Home Value in this Area
Purchase History
| Date | Buyer | Sale Price | Title Company |
|---|---|---|---|
| Knight Cheryl | -- | -- | |
| Blount Nathaniel | $89,900 | -- | |
| Torcia Richard J | $9,000 | -- | |
| Blount Nathaniel | $89,900 | -- |
Source: Public Records
Mortgage History
| Date | Status | Borrower | Loan Amount |
|---|---|---|---|
| Open | Knight Cheryl | $153,800 | |
| Previous Owner | Torcia Richard J | $97,200 | |
| Previous Owner | Torcia Richard J | $89,500 |
Source: Public Records
Tax History Compared to Growth
Tax History
| Year | Tax Paid | Tax Assessment Tax Assessment Total Assessment is a certain percentage of the fair market value that is determined by local assessors to be the total taxable value of land and additions on the property. | Land | Improvement |
|---|---|---|---|---|
| 2025 | $4,306 | $274,600 | $46,000 | $228,600 |
| 2024 | $4,193 | $261,100 | $43,000 | $218,100 |
| 2023 | $3,806 | $223,200 | $41,000 | $182,200 |
| 2022 | $3,873 | $205,800 | $41,000 | $164,800 |
| 2021 | $3,837 | $203,000 | $37,200 | $165,800 |
| 2020 | $3,398 | $174,000 | $37,200 | $136,800 |
| 2019 | $3,298 | $167,600 | $37,200 | $130,400 |
| 2018 | $3,163 | $160,700 | $37,200 | $123,500 |
| 2017 | $3,053 | $155,300 | $37,200 | $118,100 |
| 2016 | $2,990 | $152,100 | $37,200 | $114,900 |
| 2015 | $3,072 | $156,200 | $37,200 | $119,000 |
Source: Public Records
Map
Nearby Homes
- 25 Pioneer Way
- 32 Better Way
- 44 Rest Way
- 30 Jerilis Dr
- 665 Parker St
- 74 Blanche St
- 34 Temby St
- 70 Shumway St Unit 29
- 70 Shumway St Unit A1
- 401 Grayson Dr
- 20 Wrenwood St
- 89 Pine Grove St
- 193 Marmon St
- 97-99 Pine Grove St
- 98 Pine Grove St
- 200 Slater Ave
- 39 Wallace St
- 884 Parker St
- 161 Fernbank Rd
- 34 Wallace St