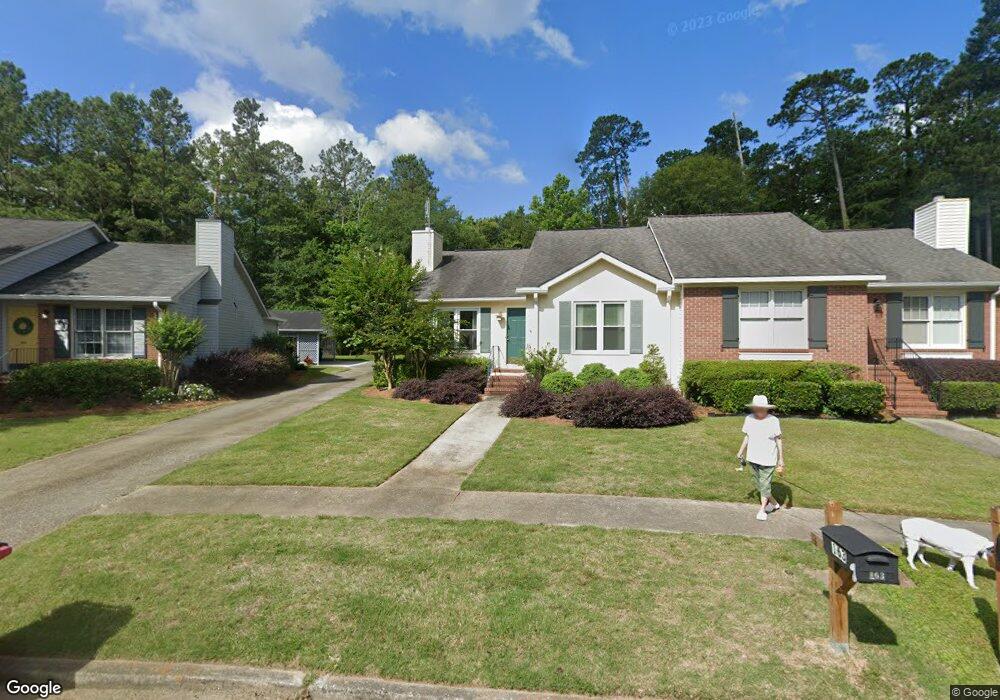
163 Manor Row Macon, GA 31210
Estimated Value: $156,970 - $172,000
2
Beds
2
Baths
1,095
Sq Ft
$148/Sq Ft
Est. Value
About This Home
This home is located at 163 Manor Row, Macon, GA 31210 and is currently estimated at $162,243, approximately $148 per square foot. 163 Manor Row is a home located in Bibb County with nearby schools including Carter Elementary School, Howard Middle School, and Howard High School.
Ownership History
Date
Name
Owned For
Owner Type
Purchase Details
Closed on
Jan 5, 2023
Sold by
Ballard Gary Walter
Bought by
Gammons Jayne M
Current Estimated Value
Home Financials for this Owner
Home Financials are based on the most recent Mortgage that was taken out on this home.
Original Mortgage
$128,250
Outstanding Balance
$123,927
Interest Rate
6.49%
Mortgage Type
New Conventional
Estimated Equity
$38,316
Purchase Details
Closed on
Mar 14, 2019
Sold by
Ngo Thuy
Bought by
Ballard Gary Walter
Home Financials for this Owner
Home Financials are based on the most recent Mortgage that was taken out on this home.
Original Mortgage
$68,000
Interest Rate
4.4%
Mortgage Type
New Conventional
Purchase Details
Closed on
Jun 6, 2016
Sold by
Phillips Brenda
Bought by
Ngo Thuy
Purchase Details
Closed on
May 16, 2016
Sold by
Creel Vanessa J
Bought by
Phillips Brenda
Purchase Details
Closed on
Jul 14, 1998
Sold by
Cox Sara Frances
Bought by
Creel Vanessa J
Create a Home Valuation Report for This Property
The Home Valuation Report is an in-depth analysis detailing your home's value as well as a comparison with similar homes in the area
Home Values in the Area
Average Home Value in this Area
Purchase History
| Date | Buyer | Sale Price | Title Company |
|---|---|---|---|
| Gammons Jayne M | $135,000 | -- | |
| Ballard Gary Walter | $85,000 | None Available | |
| Ngo Thuy | $72,000 | -- | |
| Phillips Brenda | $75,000 | -- | |
| Creel Vanessa J | $81,900 | -- |
Source: Public Records
Mortgage History
| Date | Status | Borrower | Loan Amount |
|---|---|---|---|
| Open | Gammons Jayne M | $128,250 | |
| Previous Owner | Ballard Gary Walter | $68,000 |
Source: Public Records
Tax History Compared to Growth
Tax History
| Year | Tax Paid | Tax Assessment Tax Assessment Total Assessment is a certain percentage of the fair market value that is determined by local assessors to be the total taxable value of land and additions on the property. | Land | Improvement |
|---|---|---|---|---|
| 2025 | $1,391 | $56,624 | $8,000 | $48,624 |
| 2024 | $1,255 | $49,421 | $8,000 | $41,421 |
| 2023 | $293 | $44,018 | $8,000 | $36,018 |
| 2022 | $920 | $40,472 | $5,280 | $35,192 |
| 2021 | $851 | $36,250 | $5,280 | $30,970 |
| 2020 | $782 | $34,842 | $5,280 | $29,562 |
| 2019 | $1,364 | $34,842 | $5,280 | $29,562 |
| 2018 | $2,089 | $31,848 | $5,280 | $26,568 |
| 2017 | $1,076 | $28,711 | $4,800 | $23,911 |
| 2016 | $744 | $28,500 | $4,800 | $23,700 |
| 2015 | $1,385 | $35,266 | $6,300 | $28,966 |
| 2014 | $1,387 | $35,266 | $6,300 | $28,966 |
Source: Public Records
Map
Nearby Homes
- 331 Marjane Dr
- 105 N Wellington
- 107 N Wellington
- 311 Castlegate Rd
- 5181 Zebulon Rd
- 218 Matlock Ln
- 757 Silver Springs Dr
- 111 the Vinings
- 163 Broadleaf Dr
- 106 Trillium Terrace
- 200 Stone Edge Rd
- 131 Ashford Park
- 103 Howard Oaks Dr
- 155 Howard Oaks Dr
- 137 Senora Place
- 181 Rivoli Landing
- 118 Ashford Park
- 5104 Pine Ridge Dr