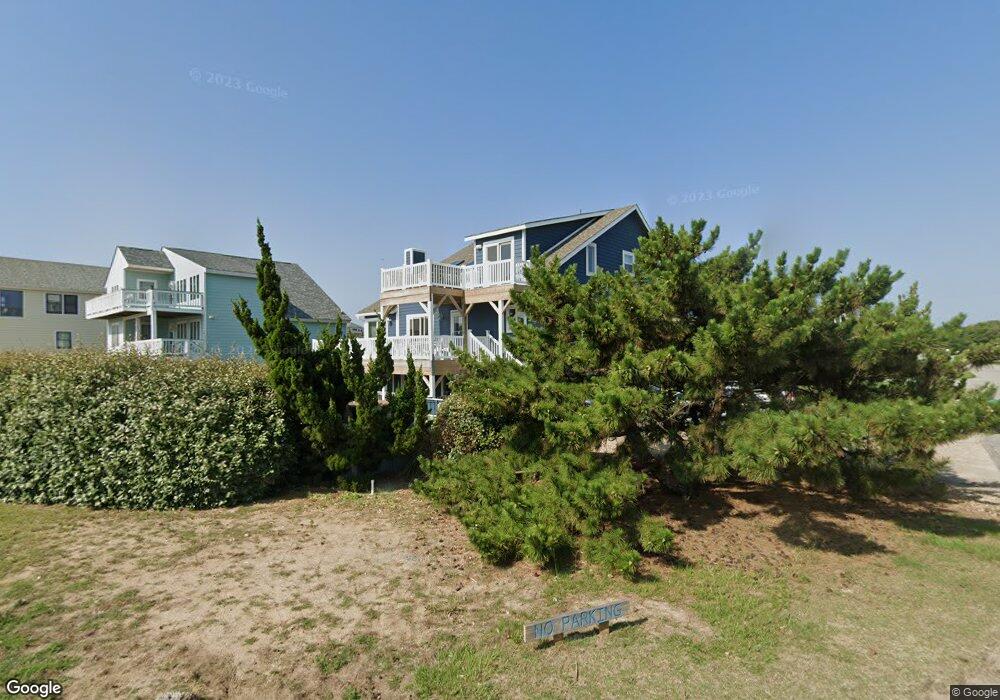
163 Ocean Way Unit 10 Kitty Hawk, NC 27949
Estimated Value: $1,277,000 - $1,573,000
5
Beds
3
Baths
2,763
Sq Ft
$526/Sq Ft
Est. Value
About This Home
This home is located at 163 Ocean Way Unit 10, Kitty Hawk, NC 27949 and is currently estimated at $1,453,409, approximately $526 per square foot. 163 Ocean Way Unit 10 is a home located in Dare County with nearby schools including Kitty Hawk Elementary School, First Flight Middle School, and First Flight High School.
Ownership History
Date
Name
Owned For
Owner Type
Purchase Details
Closed on
Jun 11, 2018
Sold by
Green Michael J and Abrego-Hayward Mary A
Bought by
Obx Box Llc
Current Estimated Value
Purchase Details
Closed on
Jun 10, 2016
Sold by
Nadworny Edward M and Nadworny Carol J
Bought by
Green Michael J and Hayward Mary Alice Abrego
Home Financials for this Owner
Home Financials are based on the most recent Mortgage that was taken out on this home.
Original Mortgage
$417,000
Interest Rate
3.58%
Mortgage Type
New Conventional
Purchase Details
Closed on
Jan 13, 2005
Sold by
Replogle John B and Replogle Kristin G
Bought by
Nadworny Edward M and Nadworny Carol J
Home Financials for this Owner
Home Financials are based on the most recent Mortgage that was taken out on this home.
Original Mortgage
$813,750
Interest Rate
4.87%
Mortgage Type
Adjustable Rate Mortgage/ARM
Create a Home Valuation Report for This Property
The Home Valuation Report is an in-depth analysis detailing your home's value as well as a comparison with similar homes in the area
Home Values in the Area
Average Home Value in this Area
Purchase History
We collect this data history from publicly available records. To have your information removed, we recommend requesting removal directly through your county’s website.
| Date | Buyer | Sale Price | Title Company |
|---|---|---|---|
| Obx Box Llc | -- | -- | |
| Green Michael J | $795,000 | None Available | |
| Nadworny Edward M | $1,162,500 | None Available |
Source: Public Records
Mortgage History
We collect this data history from publicly available records. To have your information removed, we recommend requesting removal directly through your county’s website.
| Date | Status | Borrower | Loan Amount |
|---|---|---|---|
| Previous Owner | Green Michael J | $417,000 | |
| Previous Owner | Nadworny Edward M | $813,750 |
Source: Public Records
Tax History
| Year | Tax Paid | Tax Assessment Tax Assessment Total Assessment is a certain percentage of the fair market value that is determined by local assessors to be the total taxable value of land and additions on the property. | Land | Improvement |
|---|---|---|---|---|
| 2025 | $5,975 | $1,327,300 | $770,000 | $557,300 |
| 2024 | $5,478 | $824,500 | $385,000 | $439,500 |
| 2023 | $5,225 | $842,080 | $385,000 | $457,080 |
| 2022 | $5,225 | $842,080 | $385,000 | $457,080 |
| 2021 | $5,225 | $842,080 | $385,000 | $457,080 |
| 2020 | $5,026 | $842,080 | $385,000 | $457,080 |
| 2019 | $4,114 | $579,800 | $335,800 | $244,000 |
| 2018 | $4,114 | $579,800 | $335,800 | $244,000 |
| 2017 | $4,026 | $579,800 | $335,800 | $244,000 |
| 2016 | $3,789 | $579,800 | $335,800 | $244,000 |
| 2014 | $3,840 | $587,400 | $335,800 | $251,600 |
Source: Public Records
Map
Nearby Homes
- 138 Rakiock Ct Unit Lot 53
- 134 Scarborough Ln Unit 50
- 154 Schooner Ridge Dr E Unit 86
- 103 Duck Landing Ln Unit Lot 49
- 134 Plover Dr Unit lot A-3D
- 102 Winauk Ct Unit 71
- 137 Marlin Dr Unit lot 40
- 123 Georgetown Sands Rd Unit 19
- 123 Georgetown Rd Unit 19
- 143 Bayberry Dr Unit Lot 5
- 125 Seabreeze Dr
- 125 Seabreeze Dr Unit Lot 10
- 101 Settlers Ln Unit 6
- 101 Nash Rd Unit Lot 1
- 102 Sea Hawk Dr E Unit Lot 19
- 109 Duck Ridge Village Ct Unit 14
- 110 Duck Ridge Village Ct
- 114 Sea Hawk Dr W Unit Lot 29
- 117 Osprey Ridge Rd Unit Lot 12
- 107 Sheldrake Ct Unit 43
- 163 Ocean Way
- 165 Ocean Way
- 167 Ocean Way
- 154 Ocean Way
- 158 Ocean Way Unit Parcel A
- 158 Ocean Way
- 169 Ocean Way
- 187 Ocean Front Dr
- 160 Ocean Way Unit Parcel B
- 160 Ocean Way
- 189 Ocean Front Dr
- 164 Ocean Way
- 171 Ocean Way
- 162 Ocean Way
- 185 Ocean Front Dr
- 191 Ocean Front Dr Unit Lot 17
- 191 Ocean Front Dr
- 156 Lone Way Unit 1
- 193 Ocean Front Dr
- 166 Ocean Way
Your Personal Tour Guide
Ask me questions while you tour the home.