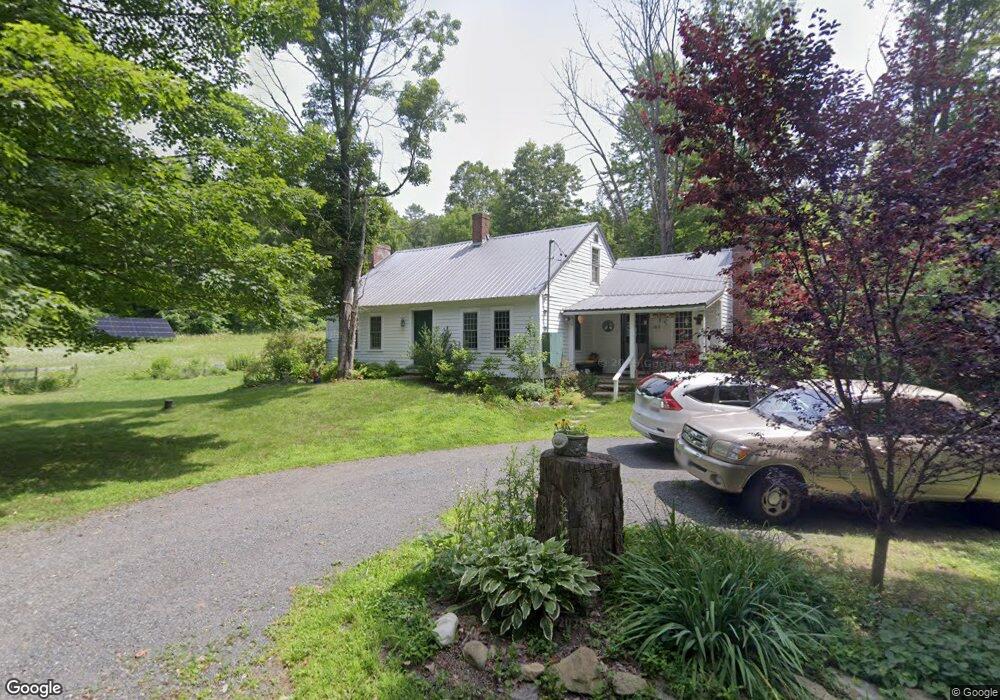
163 Ripley Rd Montague, MA 01351
Estimated Value: $438,707 - $460,000
3
Beds
2
Baths
1,827
Sq Ft
$245/Sq Ft
Est. Value
About This Home
This home is located at 163 Ripley Rd, Montague, MA 01351 and is currently estimated at $447,677, approximately $245 per square foot. 163 Ripley Rd is a home located in Franklin County.
Ownership History
Date
Name
Owned For
Owner Type
Purchase Details
Closed on
Dec 8, 2021
Sold by
Smith Katherine E
Bought by
Smith Katherine E and Harvey Lisa Y
Current Estimated Value
Purchase Details
Closed on
Feb 21, 2017
Sold by
Waltuch Michael R
Bought by
Smith Katherine E
Home Financials for this Owner
Home Financials are based on the most recent Mortgage that was taken out on this home.
Original Mortgage
$168,000
Interest Rate
4.2%
Mortgage Type
New Conventional
Create a Home Valuation Report for This Property
The Home Valuation Report is an in-depth analysis detailing your home's value as well as a comparison with similar homes in the area
Home Values in the Area
Average Home Value in this Area
Purchase History
| Date | Buyer | Sale Price | Title Company |
|---|---|---|---|
| Smith Katherine E | -- | None Available | |
| Smith Katherine E | -- | None Available | |
| Smith Katherine E | -- | None Available | |
| Smith Katherine E | $210,000 | -- | |
| Smith Katherine E | $210,000 | -- | |
| Smith Katherine E | $210,000 | -- | |
| Smith Katherine E | $210,000 | -- |
Source: Public Records
Mortgage History
| Date | Status | Borrower | Loan Amount |
|---|---|---|---|
| Previous Owner | Smith Katherine E | $168,000 |
Source: Public Records
Tax History Compared to Growth
Tax History
| Year | Tax Paid | Tax Assessment Tax Assessment Total Assessment is a certain percentage of the fair market value that is determined by local assessors to be the total taxable value of land and additions on the property. | Land | Improvement |
|---|---|---|---|---|
| 2025 | $4,700 | $309,000 | $83,600 | $225,400 |
| 2024 | $4,487 | $285,800 | $83,600 | $202,200 |
| 2023 | $4,407 | $281,600 | $83,600 | $198,000 |
| 2022 | $4,249 | $253,500 | $83,600 | $169,900 |
| 2021 | $4,050 | $232,200 | $78,400 | $153,800 |
| 2020 | $4,152 | $236,300 | $94,500 | $141,800 |
| 2019 | $3,645 | $212,800 | $96,000 | $116,800 |
| 2018 | $3,580 | $209,500 | $96,000 | $113,500 |
| 2017 | $3,444 | $206,600 | $96,000 | $110,600 |
| 2016 | $3,457 | $196,300 | $96,400 | $99,900 |
| 2015 | $3,329 | $196,300 | $96,400 | $99,900 |
| 2014 | $3,273 | $200,300 | $96,400 | $103,900 |
Source: Public Records
Map
Nearby Homes
- 142 N Leverett Rd
- 157 Ripley Rd
- 177 Ripley Rd
- 141 Ripley Rd
- 154 N Leverett Rd
- 133 Ripley Rd
- 159 N Leverett Rd
- 162 N Leverett Rd
- 195 Ripley Rd
- 123 Ripley Rd
- 167 N Leverett Rd
- 2 N Leverett Rd
- 11 W Chestnut Hill Rd
- 0 Chestnut Hill Rd Unit 30297217
- 1 N Leverett Rd
- 114 Ripley Rd
- 0 W Chestnut Rd Unit 71416367
- 0 W Chestnut Hill Rd Unit 72386214
- 0 W Chestnut Hill Rd Unit 72699995
- 8 W Chestnut Hill Rd