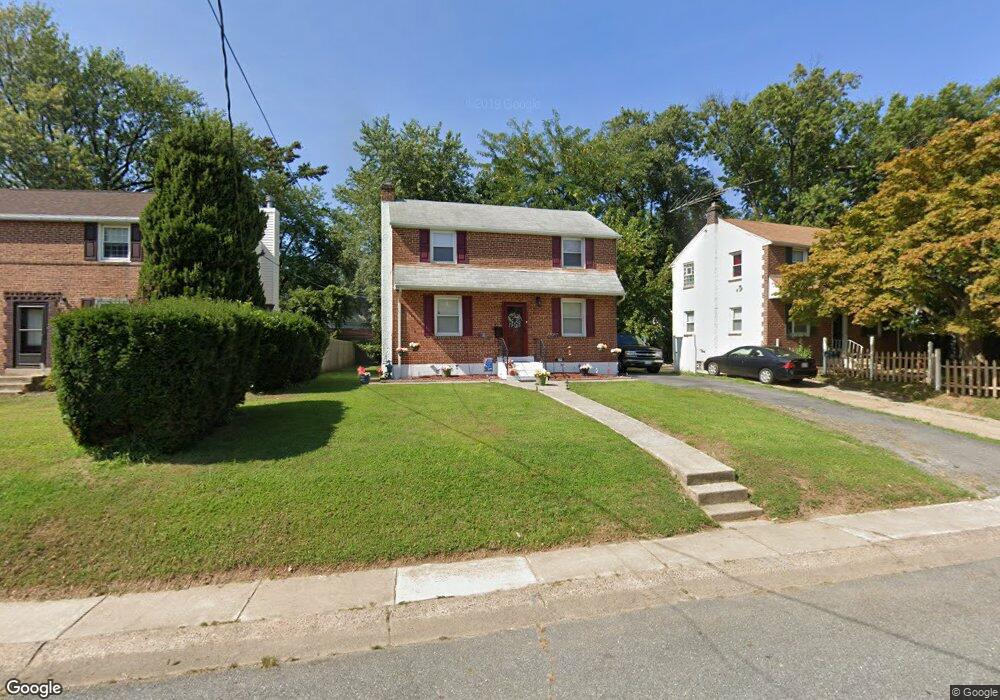
163 Riverview Dr New Castle, DE 19720
Estimated Value: $262,000 - $282,000
3
Beds
1
Bath
1,232
Sq Ft
$219/Sq Ft
Est. Value
About This Home
This home is located at 163 Riverview Dr, New Castle, DE 19720 and is currently estimated at $270,131, approximately $219 per square foot. 163 Riverview Dr is a home located in New Castle County with nearby schools including New Castle Elementary School, Calvin R. McCullough Middle School, and Charter School of New Castle.
Ownership History
Date
Name
Owned For
Owner Type
Purchase Details
Closed on
Oct 18, 2002
Sold by
Lindbergh Edward L
Bought by
Taylor Darlene M
Current Estimated Value
Home Financials for this Owner
Home Financials are based on the most recent Mortgage that was taken out on this home.
Original Mortgage
$112,527
Outstanding Balance
$47,314
Interest Rate
6.2%
Estimated Equity
$222,817
Purchase Details
Closed on
Apr 29, 2002
Sold by
Reider Properties Inc
Bought by
Lindbergh Edward L
Home Financials for this Owner
Home Financials are based on the most recent Mortgage that was taken out on this home.
Original Mortgage
$73,500
Interest Rate
7.05%
Create a Home Valuation Report for This Property
The Home Valuation Report is an in-depth analysis detailing your home's value as well as a comparison with similar homes in the area
Home Values in the Area
Average Home Value in this Area
Purchase History
| Date | Buyer | Sale Price | Title Company |
|---|---|---|---|
| Taylor Darlene M | $59,225 | -- | |
| Lindbergh Edward L | $62,500 | -- |
Source: Public Records
Mortgage History
| Date | Status | Borrower | Loan Amount |
|---|---|---|---|
| Open | Taylor Darlene M | $112,527 | |
| Previous Owner | Lindbergh Edward L | $73,500 |
Source: Public Records
Tax History Compared to Growth
Tax History
| Year | Tax Paid | Tax Assessment Tax Assessment Total Assessment is a certain percentage of the fair market value that is determined by local assessors to be the total taxable value of land and additions on the property. | Land | Improvement |
|---|---|---|---|---|
| 2024 | $1,191 | $34,700 | $5,300 | $29,400 |
| 2023 | $1,083 | $34,700 | $5,300 | $29,400 |
| 2022 | $1,128 | $34,700 | $5,300 | $29,400 |
| 2021 | $1,128 | $34,700 | $5,300 | $29,400 |
| 2020 | $1,135 | $34,700 | $5,300 | $29,400 |
| 2019 | $1,414 | $34,700 | $5,300 | $29,400 |
| 2018 | $1,112 | $34,700 | $5,300 | $29,400 |
| 2017 | $1,040 | $34,700 | $5,300 | $29,400 |
| 2016 | $931 | $34,700 | $5,300 | $29,400 |
| 2015 | $931 | $34,700 | $5,300 | $29,400 |
| 2014 | $931 | $34,700 | $5,300 | $29,400 |
Source: Public Records
Map
Nearby Homes