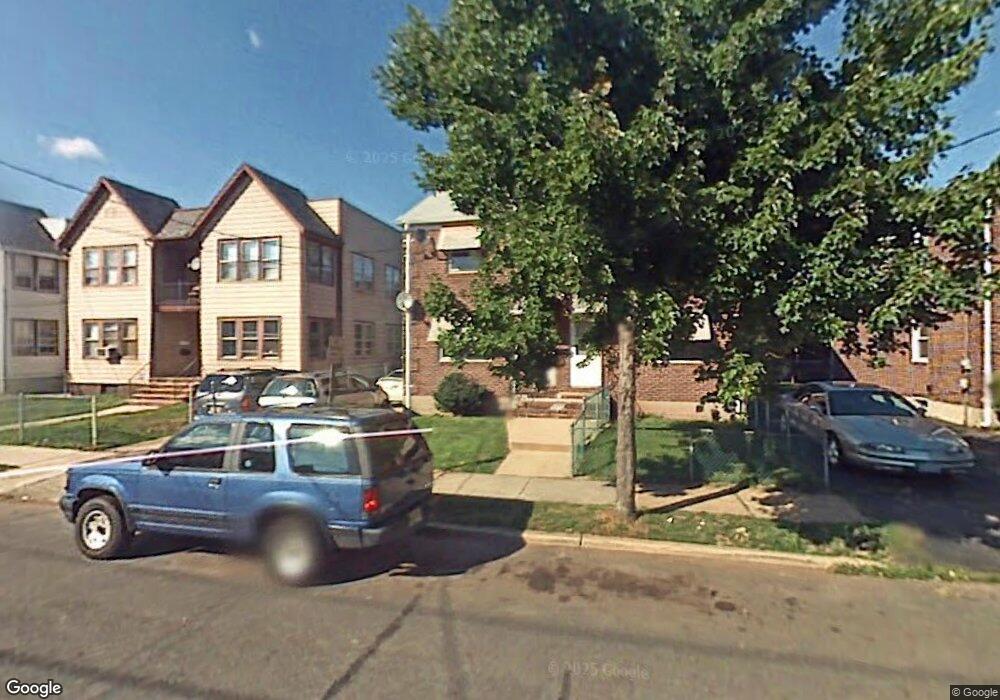
163 Rutgers St New Brunswick, NJ 08901
Estimated Value: $258,000 - $297,676
2
Beds
1
Bath
896
Sq Ft
$314/Sq Ft
Est. Value
About This Home
This home is located at 163 Rutgers St, New Brunswick, NJ 08901 and is currently estimated at $281,419, approximately $314 per square foot. 163 Rutgers St is a home located in Middlesex County with nearby schools including New Brunswick High School, Central Jersey College Prep Charter School, and Greater Brunswick Charter School.
Ownership History
Date
Name
Owned For
Owner Type
Purchase Details
Closed on
Dec 4, 2006
Current Estimated Value
Purchase Details
Closed on
Oct 3, 2005
Sold by
Soberano Daniel
Bought by
Gomez Radhames
Home Financials for this Owner
Home Financials are based on the most recent Mortgage that was taken out on this home.
Original Mortgage
$156,800
Interest Rate
7%
Mortgage Type
Adjustable Rate Mortgage/ARM
Purchase Details
Closed on
Jan 6, 2004
Sold by
Jaquez Yudelka
Bought by
Soberano Daniel
Home Financials for this Owner
Home Financials are based on the most recent Mortgage that was taken out on this home.
Original Mortgage
$156,700
Interest Rate
5.67%
Purchase Details
Closed on
Apr 5, 2002
Sold by
Heredia Emilio
Bought by
Jaquez Yudelka and Reyes Jose
Home Financials for this Owner
Home Financials are based on the most recent Mortgage that was taken out on this home.
Original Mortgage
$99,317
Interest Rate
7.01%
Create a Home Valuation Report for This Property
The Home Valuation Report is an in-depth analysis detailing your home's value as well as a comparison with similar homes in the area
Home Values in the Area
Average Home Value in this Area
Purchase History
| Date | Buyer | Sale Price | Title Company |
|---|---|---|---|
| -- | $100 | -- | |
| Gomez Radhames | $196,000 | -- | |
| Soberano Daniel | $165,000 | -- | |
| Jaquez Yudelka | $103,000 | -- |
Source: Public Records
Mortgage History
| Date | Status | Borrower | Loan Amount |
|---|---|---|---|
| Previous Owner | Gomez Radhames | $156,800 | |
| Previous Owner | Soberano Daniel | $156,700 | |
| Previous Owner | Jaquez Yudelka | $99,317 |
Source: Public Records
Tax History Compared to Growth
Tax History
| Year | Tax Paid | Tax Assessment Tax Assessment Total Assessment is a certain percentage of the fair market value that is determined by local assessors to be the total taxable value of land and additions on the property. | Land | Improvement |
|---|---|---|---|---|
| 2025 | $3,839 | $146,600 | $89,600 | $57,000 |
| 2024 | $3,728 | $146,600 | $89,600 | $57,000 |
| 2023 | $3,728 | $146,600 | $89,600 | $57,000 |
| 2022 | $3,649 | $146,600 | $89,600 | $57,000 |
| 2021 | $2,707 | $146,600 | $89,600 | $57,000 |
| 2020 | $3,621 | $146,600 | $89,600 | $57,000 |
| 2019 | $3,552 | $146,600 | $89,600 | $57,000 |
| 2018 | $3,471 | $146,600 | $89,600 | $57,000 |
| 2017 | $3,334 | $146,600 | $89,600 | $57,000 |
| 2016 | $4,036 | $68,800 | $22,400 | $46,400 |
| 2015 | $3,939 | $68,800 | $22,400 | $46,400 |
| 2014 | $3,869 | $68,800 | $22,400 | $46,400 |
Source: Public Records
Map
Nearby Homes
- 201 Fulton St
- 184 Lawrence St
- 340 Livingston Ave
- 95 Renaissance Ln
- 122 Lawrence St Unit 26
- 200 Talmadge St
- 25 Rutgers St
- 1234 Dogwood Ct
- 1224 Dogwood Ct
- 76 May St
- 14 Edgeworth Place
- 11 Edgeworth Place
- 105 N Talmadge St
- 158 Lee Ave
- 18 N Talmadge St
- 294 Howard St
- 15 N Talmadge St
- 82 S Ward St
- 640 Livingston Ave
- 37 Hazelhurst St