1630 E Tudor Rd Anchorage, AK 99507
Campbell Park NeighborhoodEstimated Value: $11,751,683
--
Bed
--
Bath
29,954
Sq Ft
$392/Sq Ft
Est. Value
About This Home
This home is located at 1630 E Tudor Rd, Anchorage, AK 99507 and is currently estimated at $11,751,683, approximately $392 per square foot. 1630 E Tudor Rd is a home located in Anchorage Municipality with nearby schools including Tudor Elementary School, Wendler Middle School, and Bettye Davis East Anchorage High School.
Ownership History
Date
Name
Owned For
Owner Type
Purchase Details
Closed on
Apr 24, 2013
Sold by
Trent Liodmilla
Bought by
Pacific Tudor 2011 Llc
Current Estimated Value
Purchase Details
Closed on
Feb 15, 2012
Sold by
Berkshire Dea Anchorage Associates Lp
Bought by
Pacific Tudor 2011 Llc
Purchase Details
Closed on
Feb 11, 2008
Sold by
Gsa/Dea Llc
Bought by
Berkshire Dea Anchorage Associates Lp
Home Financials for this Owner
Home Financials are based on the most recent Mortgage that was taken out on this home.
Original Mortgage
$3,025,000
Interest Rate
6.04%
Mortgage Type
Commercial
Purchase Details
Closed on
May 24, 2001
Sold by
Blomfield Charles A and Blomfield Sandra I
Bought by
Gsa/Dea Llc
Home Financials for this Owner
Home Financials are based on the most recent Mortgage that was taken out on this home.
Original Mortgage
$3,112,500
Interest Rate
7.06%
Mortgage Type
Commercial
Purchase Details
Closed on
May 23, 2001
Sold by
Blomfield Charles A and Blomfield Sandra I
Bought by
Gsa Dea Llc
Home Financials for this Owner
Home Financials are based on the most recent Mortgage that was taken out on this home.
Original Mortgage
$3,112,500
Interest Rate
7.06%
Mortgage Type
Commercial
Create a Home Valuation Report for This Property
The Home Valuation Report is an in-depth analysis detailing your home's value as well as a comparison with similar homes in the area
Home Values in the Area
Average Home Value in this Area
Purchase History
| Date | Buyer | Sale Price | Title Company |
|---|---|---|---|
| Pacific Tudor 2011 Llc | -- | None Available | |
| Pacific Tudor 2011 Llc | -- | Ftaa | |
| Berkshire Dea Anchorage Associates Lp | -- | None Available | |
| Gsa/Dea Llc | -- | -- | |
| Gsa/Dea Llc | -- | -- | |
| Gsa Dea Llc | -- | -- |
Source: Public Records
Mortgage History
| Date | Status | Borrower | Loan Amount |
|---|---|---|---|
| Previous Owner | Berkshire Dea Anchorage Associates Lp | $3,025,000 | |
| Previous Owner | Gsa/Dea Llc | $3,112,500 | |
| Previous Owner | Gsa Dea Llc | $3,112,500 |
Source: Public Records
Tax History Compared to Growth
Tax History
| Year | Tax Paid | Tax Assessment Tax Assessment Total Assessment is a certain percentage of the fair market value that is determined by local assessors to be the total taxable value of land and additions on the property. | Land | Improvement |
|---|---|---|---|---|
| 2025 | $73,400 | $4,609,100 | $1,251,100 | $3,358,000 |
| 2024 | $73,400 | $4,546,300 | $1,251,100 | $3,295,200 |
| 2023 | $76,221 | $4,475,700 | $1,251,100 | $3,224,600 |
| 2022 | $73,628 | $4,372,200 | $1,287,200 | $3,085,000 |
| 2021 | $80,679 | $4,477,200 | $1,287,200 | $3,190,000 |
| 2020 | $79,575 | $4,680,900 | $1,261,700 | $3,419,200 |
| 2019 | $77,193 | $4,718,400 | $1,237,000 | $3,481,400 |
| 2018 | $76,703 | $4,677,000 | $1,237,000 | $3,440,000 |
| 2017 | $75,751 | $4,909,600 | $1,237,000 | $3,672,600 |
| 2016 | $69,363 | $4,915,800 | $1,237,000 | $3,678,800 |
| 2015 | $69,363 | $4,814,700 | $1,156,700 | $3,658,000 |
| 2014 | $69,363 | $4,719,700 | $1,156,700 | $3,563,000 |
Source: Public Records
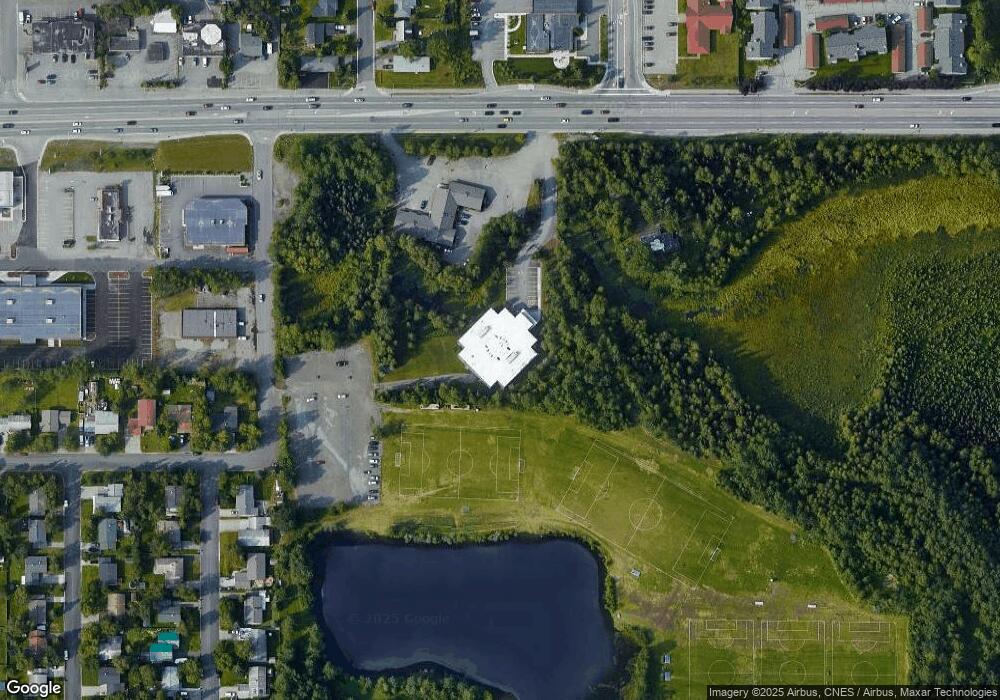
Map
Nearby Homes
- 1819 E Tudor Rd Unit B102
- 1401 Chirikof Ct
- 4141 Grape Place
- 1877 E Tudor Rd Unit E101
- 4140 Grape Place
- 4130 Grape Place
- 1506 Cache Dr
- 4733 Becharof St
- 1747 Wickersham Dr
- 1715 Bartlett Dr
- 2090 Dimond Dr
- 4904 Barrington Loop Unit 29
- 3740 Mount Blanc Cir
- 5321 Larkspur St
- 3818 Helvetia Dr
- 3531 Wingate Cir
- 5350 Little Tree St
- 3701 Young St
- 4246 Laurel St
- 3421 Cottonwood St
- 4621 Shelikof St
- 1600 E Tudor Rd
- 1600 E Tudor Rd
- 1600 E Tudor Rd
- 1600 E Tudor Rd
- 1600 E Tudor Rd Unit B
- 1700 E Tudor Rd
- 1429 Chirikof Ct
- 4601 Shelikof St
- 4310 Needle Cir
- 4520 Shelikof St
- 4611 Shelikof St
- L12 B3 Shelikof Ct
- 000 Shelikof St
- NHS Shelikof St
- 1419 Chirikof Ct
- 4308 Needle Cir
- 4621 Shelikof St
- Tr G3 Tudor Rd
- Tr G1 Tudor Rd