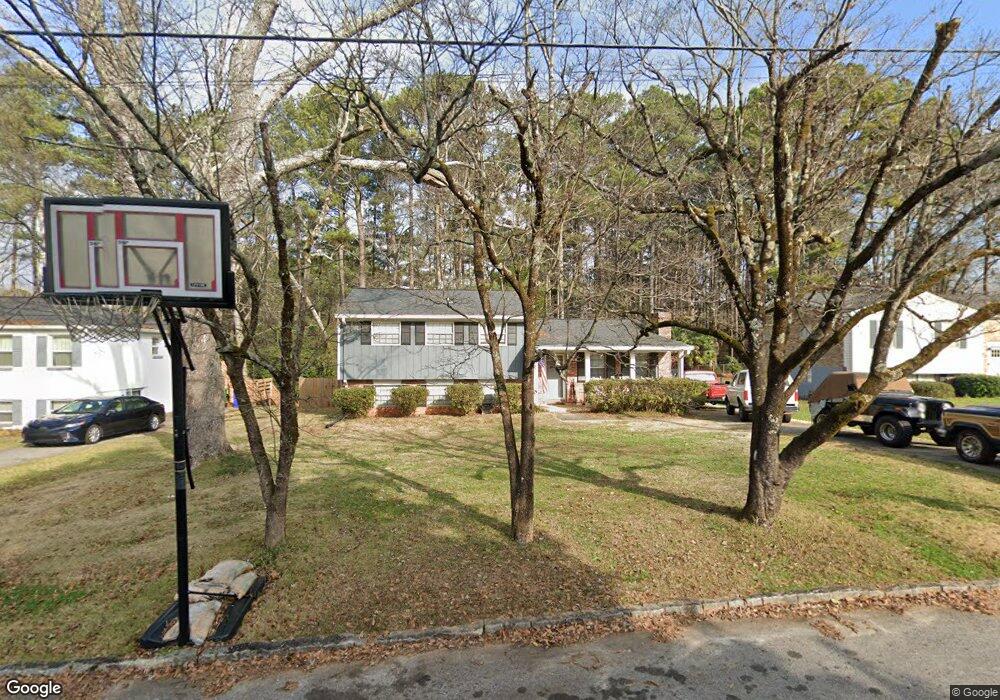
1630 Edinburgh Dr Tucker, GA 30084
Estimated Value: $368,000 - $395,000
3
Beds
2
Baths
1,526
Sq Ft
$252/Sq Ft
Est. Value
About This Home
This home is located at 1630 Edinburgh Dr, Tucker, GA 30084 and is currently estimated at $384,010, approximately $251 per square foot. 1630 Edinburgh Dr is a home located in DeKalb County with nearby schools including Brockett Elementary School, Tucker Middle School, and Tucker High School.
Ownership History
Date
Name
Owned For
Owner Type
Purchase Details
Closed on
Apr 22, 2010
Sold by
Nelms Gregory W
Bought by
Harris John C
Current Estimated Value
Home Financials for this Owner
Home Financials are based on the most recent Mortgage that was taken out on this home.
Original Mortgage
$152,000
Interest Rate
6%
Purchase Details
Closed on
Jun 26, 2008
Sold by
Kemp Karl
Bought by
Nelms Gregory W
Home Financials for this Owner
Home Financials are based on the most recent Mortgage that was taken out on this home.
Original Mortgage
$152,000
Interest Rate
5.96%
Mortgage Type
New Conventional
Purchase Details
Closed on
Nov 24, 2004
Sold by
Massey James and Massey Margaret N
Bought by
Kemp Karl
Home Financials for this Owner
Home Financials are based on the most recent Mortgage that was taken out on this home.
Original Mortgage
$129,900
Interest Rate
5.67%
Mortgage Type
New Conventional
Create a Home Valuation Report for This Property
The Home Valuation Report is an in-depth analysis detailing your home's value as well as a comparison with similar homes in the area
Home Values in the Area
Average Home Value in this Area
Purchase History
| Date | Buyer | Sale Price | Title Company |
|---|---|---|---|
| Harris John C | -- | -- | |
| Nelms Gregory W | $172,000 | -- | |
| Kemp Karl | $169,900 | -- |
Source: Public Records
Mortgage History
| Date | Status | Borrower | Loan Amount |
|---|---|---|---|
| Closed | Harris John C | $152,000 | |
| Previous Owner | Nelms Gregory W | $152,000 | |
| Previous Owner | Kemp Karl | $129,900 |
Source: Public Records
Tax History Compared to Growth
Tax History
| Year | Tax Paid | Tax Assessment Tax Assessment Total Assessment is a certain percentage of the fair market value that is determined by local assessors to be the total taxable value of land and additions on the property. | Land | Improvement |
|---|---|---|---|---|
| 2025 | $4,045 | $152,440 | $36,000 | $116,440 |
| 2024 | $3,971 | $146,560 | $36,000 | $110,560 |
| 2023 | $3,971 | $135,760 | $36,000 | $99,760 |
| 2022 | $3,226 | $108,600 | $22,520 | $86,080 |
| 2021 | $2,762 | $86,800 | $22,520 | $64,280 |
| 2020 | $2,643 | $82,840 | $12,320 | $70,520 |
| 2019 | $2,328 | $70,400 | $12,320 | $58,080 |
| 2018 | $2,207 | $66,640 | $12,320 | $54,320 |
| 2017 | $2,210 | $62,600 | $12,320 | $50,280 |
| 2016 | $2,326 | $69,040 | $12,320 | $56,720 |
| 2014 | $1,885 | $56,560 | $12,320 | $44,240 |
Source: Public Records
Map
Nearby Homes
- 1608 Cooledge Rd
- 3636 Castle Rock Way
- 1661 Avon Ave
- 3630 Prince Way
- 1661 Zemory Dr
- 3722 S Marlborough Dr
- 3533 Johns Rd
- 1517 Vancouver Dr
- 3620 Wind River Ct
- 3453 Woodlawn Cir
- 1864 Stockton Dr
- 3788 Sarahs Ln
- 3718 Sheridan St
- 3952 Cedar Cir
- 1894 Hebron Hills Dr
- 1905 Robinhill Ct
- 3965 Camelot Ct
- 1362 Brockett Place Unit 1362
- 1624 Edinburgh Dr
- 1636 Edinburgh Dr Unit 3
- 1570 Avon Ave
- 1642 Edinburgh Dr
- 1618 Edinburgh Dr
- 1564 Avon Ave Unit 2
- 1633 Edinburgh Dr
- 1627 Edinburgh Dr Unit III
- 1584 Avon Ave
- 1643 Edinburgh Dr
- 1621 Edinburgh Dr Unit 3
- 1648 Edinburgh Dr Unit III
- 1558 Avon Ave
- 1659 Edinburgh Dr
- 1615 Edinburgh Dr Unit 3
- 1606 Edinburgh Dr Unit 3
- 1550 Avon Ave
- 1658 Edinburgh Dr
- 3676 Castle Rock Way
- 3670 Castle Rock Way