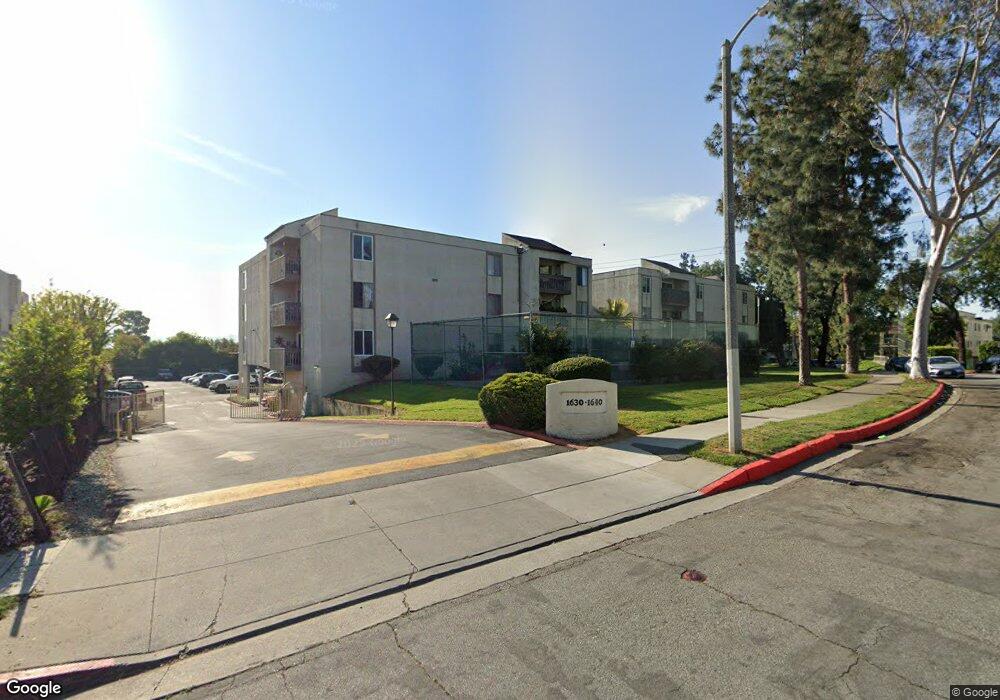
1630 Neil Armstrong St Unit 317 Montebello, CA 90640
Estimated Value: $403,000 - $445,824
2
Beds
2
Baths
946
Sq Ft
$457/Sq Ft
Est. Value
About This Home
This home is located at 1630 Neil Armstrong St Unit 317, Montebello, CA 90640 and is currently estimated at $432,206, approximately $456 per square foot. 1630 Neil Armstrong St Unit 317 is a home located in Los Angeles County with nearby schools including Potrero Heights Elementary School, Macy Intermediate School, and Schurr High School.
Ownership History
Date
Name
Owned For
Owner Type
Purchase Details
Closed on
Oct 21, 2021
Sold by
Alice A Kakuda Living Trust and Kakuda Alice A
Bought by
Riley Michael
Current Estimated Value
Purchase Details
Closed on
Jul 24, 2014
Sold by
Kakuda Alice A
Bought by
Kakuda Alice A and The Alice A Kakuda Living Trus
Home Financials for this Owner
Home Financials are based on the most recent Mortgage that was taken out on this home.
Original Mortgage
$70,000
Interest Rate
4.12%
Mortgage Type
New Conventional
Purchase Details
Closed on
Jul 18, 2014
Sold by
Kakuda Alice A and The Alice A Kakuda Living Trus
Bought by
Kakuda Alice A
Home Financials for this Owner
Home Financials are based on the most recent Mortgage that was taken out on this home.
Original Mortgage
$70,000
Interest Rate
4.12%
Mortgage Type
New Conventional
Purchase Details
Closed on
Mar 7, 2005
Sold by
Kakuda Alice A and Kakuda Alice Aiko
Bought by
Kakuda Alice A and The Alice A Kakuda Living Trus
Create a Home Valuation Report for This Property
The Home Valuation Report is an in-depth analysis detailing your home's value as well as a comparison with similar homes in the area
Home Values in the Area
Average Home Value in this Area
Purchase History
| Date | Buyer | Sale Price | Title Company |
|---|---|---|---|
| Riley Michael | $310,000 | Chicago Title | |
| Kakuda Alice A | -- | Western Resources Title | |
| Kakuda Alice A | -- | Western Resources Title | |
| Kakuda Alice A | -- | -- |
Source: Public Records
Mortgage History
| Date | Status | Borrower | Loan Amount |
|---|---|---|---|
| Previous Owner | Kakuda Alice A | $70,000 |
Source: Public Records
Tax History Compared to Growth
Tax History
| Year | Tax Paid | Tax Assessment Tax Assessment Total Assessment is a certain percentage of the fair market value that is determined by local assessors to be the total taxable value of land and additions on the property. | Land | Improvement |
|---|---|---|---|---|
| 2025 | $5,725 | $409,625 | $275,914 | $133,711 |
| 2024 | $5,725 | $401,594 | $270,504 | $131,090 |
| 2023 | $5,720 | $393,720 | $265,200 | $128,520 |
| 2022 | $5,527 | $386,000 | $260,000 | $126,000 |
| 2021 | $2,088 | $142,181 | $15,099 | $127,082 |
| 2019 | $2,009 | $137,965 | $14,652 | $123,313 |
| 2018 | $2,040 | $135,261 | $14,365 | $120,896 |
| 2016 | $1,942 | $130,010 | $13,808 | $116,202 |
| 2015 | $1,838 | $128,058 | $13,601 | $114,457 |
| 2014 | $1,818 | $125,550 | $13,335 | $112,215 |
Source: Public Records
Map
Nearby Homes
- 1603 Firvale Ave
- 1661 Neil Armstrong St Unit 246
- 1765 Neil Armstrong St Unit 202
- 185 Orchid Ct
- 598 Alder Way
- 1604 N Jerseydale Ave
- 8254 Lily Dr
- 1888 Hollyleaf Terrace
- Aria 1A Plan at Metro Heights - Aria
- Aria 1B Plan at Metro Heights - Aria
- Aria 2B Plan at Metro Heights - Aria
- Aria 1BX Plan at Metro Heights - Aria
- Aria 3AXR Plan at Metro Heights - Aria
- Aria 2BX Plan at Metro Heights - Aria
- Aria 3BXR Plan at Metro Heights - Aria
- Aria 3A Plan at Metro Heights - Aria
- Aria 2A Plan at Metro Heights - Aria
- Aria 3BR Plan at Metro Heights - Aria
- Aria 3B Plan at Metro Heights - Aria
- Aria 1AX Plan at Metro Heights - Aria
- 1630 Neil Armstrong St
- 1640 Neil Armstrong St
- 1630 Neil Armstrong St Unit 114
- 1630 Neil Armstrong St Unit 112
- 1630 Neil Armstrong St Unit 111
- 1630 Neil Armstrong St Unit 110
- 1630 Neil Armstrong St Unit 108
- 1630 Neil Armstrong St Unit 107
- 1630 Neil Armstrong St Unit 106
- 1630 Neil Armstrong St Unit 104
- 1630 Neil Armstrong St Unit 103
- 1630 Neil Armstrong St Unit 102
- 1630 Neil Armstrong St Unit 101
- 1640 Neil Armstrong St Unit 309
- 1640 Neil Armstrong St Unit 308
- 1640 Neil Armstrong St Unit 307
- 1640 Neil Armstrong St Unit 306
- 1640 Neil Armstrong St Unit 304
- 1630 Neil Armstrong St Unit 316
- 1630 Neil Armstrong St Unit 315