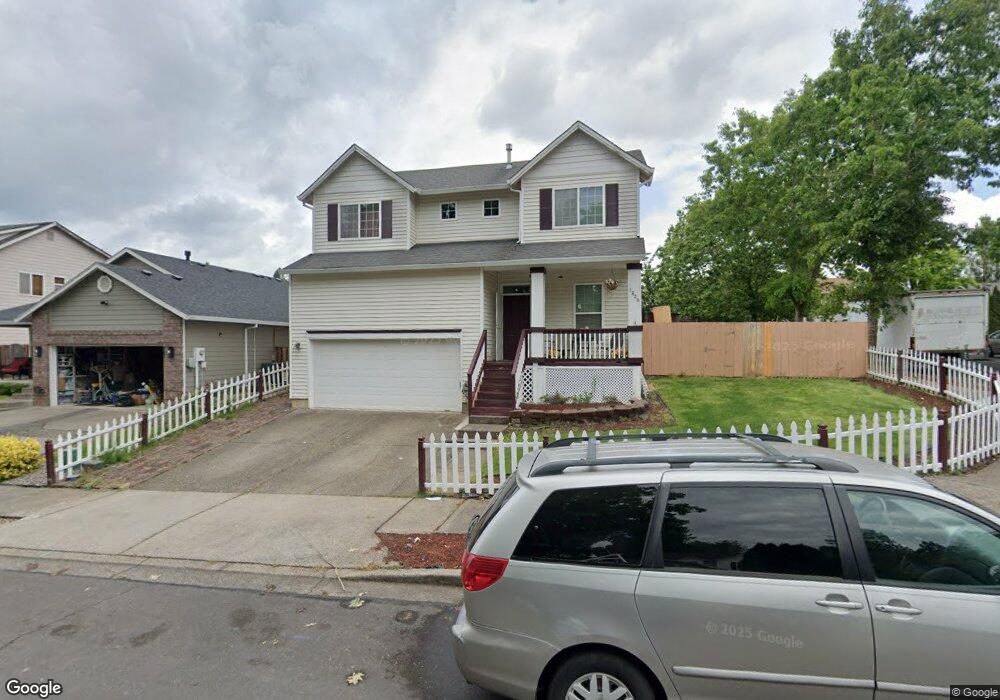
1630 SE Larch Way Gresham, OR 97080
Kelly Creek NeighborhoodEstimated Value: $467,000 - $553,000
4
Beds
3
Baths
2,075
Sq Ft
$248/Sq Ft
Est. Value
About This Home
This home is located at 1630 SE Larch Way, Gresham, OR 97080 and is currently estimated at $515,208, approximately $248 per square foot. 1630 SE Larch Way is a home located in Multnomah County with nearby schools including Powell Valley Elementary School, Gordon Russell Middle School, and Sam Barlow High School.
Ownership History
Date
Name
Owned For
Owner Type
Purchase Details
Closed on
Oct 15, 2015
Sold by
Fannie Mae
Bought by
Riad Mokbel and Salib Shereen
Current Estimated Value
Home Financials for this Owner
Home Financials are based on the most recent Mortgage that was taken out on this home.
Original Mortgage
$209,835
Outstanding Balance
$164,530
Interest Rate
3.86%
Mortgage Type
New Conventional
Estimated Equity
$350,678
Purchase Details
Closed on
Jun 29, 2015
Sold by
Brimo Mohammad S
Bought by
Wells Fargo Bank Na
Purchase Details
Closed on
Jun 8, 2015
Sold by
Wells Fargo Bank Na
Bought by
Federal National Mortgage Association and Fnma
Purchase Details
Closed on
Dec 16, 1999
Sold by
Kehoe Company
Bought by
Brimo Mohammad S
Home Financials for this Owner
Home Financials are based on the most recent Mortgage that was taken out on this home.
Original Mortgage
$173,343
Interest Rate
7.82%
Mortgage Type
FHA
Create a Home Valuation Report for This Property
The Home Valuation Report is an in-depth analysis detailing your home's value as well as a comparison with similar homes in the area
Home Values in the Area
Average Home Value in this Area
Purchase History
| Date | Buyer | Sale Price | Title Company |
|---|---|---|---|
| Riad Mokbel | $230,000 | Nextitle | |
| Wells Fargo Bank Na | $381,148 | None Available | |
| Federal National Mortgage Association | -- | None Available | |
| Brimo Mohammad S | $175,400 | First American Title Co |
Source: Public Records
Mortgage History
| Date | Status | Borrower | Loan Amount |
|---|---|---|---|
| Open | Riad Mokbel | $209,835 | |
| Previous Owner | Brimo Mohammad S | $173,343 |
Source: Public Records
Tax History
| Year | Tax Paid | Tax Assessment Tax Assessment Total Assessment is a certain percentage of the fair market value that is determined by local assessors to be the total taxable value of land and additions on the property. | Land | Improvement |
|---|---|---|---|---|
| 2025 | $5,329 | $261,890 | -- | -- |
| 2024 | $5,102 | $254,270 | -- | -- |
| 2023 | $4,648 | $246,870 | $0 | $0 |
| 2022 | $4,518 | $239,680 | $0 | $0 |
| 2021 | $4,404 | $232,700 | $0 | $0 |
| 2020 | $4,144 | $225,930 | $0 | $0 |
| 2019 | $4,035 | $219,350 | $0 | $0 |
| 2018 | $3,848 | $212,970 | $0 | $0 |
| 2017 | $3,692 | $206,770 | $0 | $0 |
| 2016 | $3,255 | $200,750 | $0 | $0 |
Source: Public Records
Map
Nearby Homes
- 5827 SE 16th Loop
- 5856 SE Woodland Dr
- 6106 SE 16th St
- 6103 SE 16th St
- 6112 SE 16th St
- 6109 SE 16th St
- 6118 SE 16th St
- 6115 SE 16th St
- 1490 SE Pheasant Ave
- 6171 SE 16th St
- 6187 SE 16th St
- 6195 SE 16th St
- 6192 SE 15th St
- 2404 SE Jasmine Way
- 6247 SE 15th St
- 2314 SE Keller Ave
- 6421 SE 22nd St
- 6443 SE 22nd St
- 6490 SE 21st St
- 1536 SE Condor Ave
- 1606 SE Larch Way
- 1691 SE Mimosa Dr
- 1647 SE Mimosa Dr
- 1602 SE Larch Way
- 1665 SE Larch Way
- 1687 SE Larch Way
- 5696 SE 16th Dr
- 1603 SE Mimosa Dr
- 1657 SE Larch Way
- 1695 SE Larch Way
- 1641 SE Larch Way
- 1590 SE Larch Way
- 1633 SE Larch Way Bwo Dog
- 1633 SE Larch Way
- 5660 SE 16th Dr
- 1579 SE Mimosa Dr
- 5731 SE 18th Ct
- 5757 SE 18th Ct
- 1589 SE Larch Way
- 1576 SE Larch Way
Your Personal Tour Guide
Ask me questions while you tour the home.