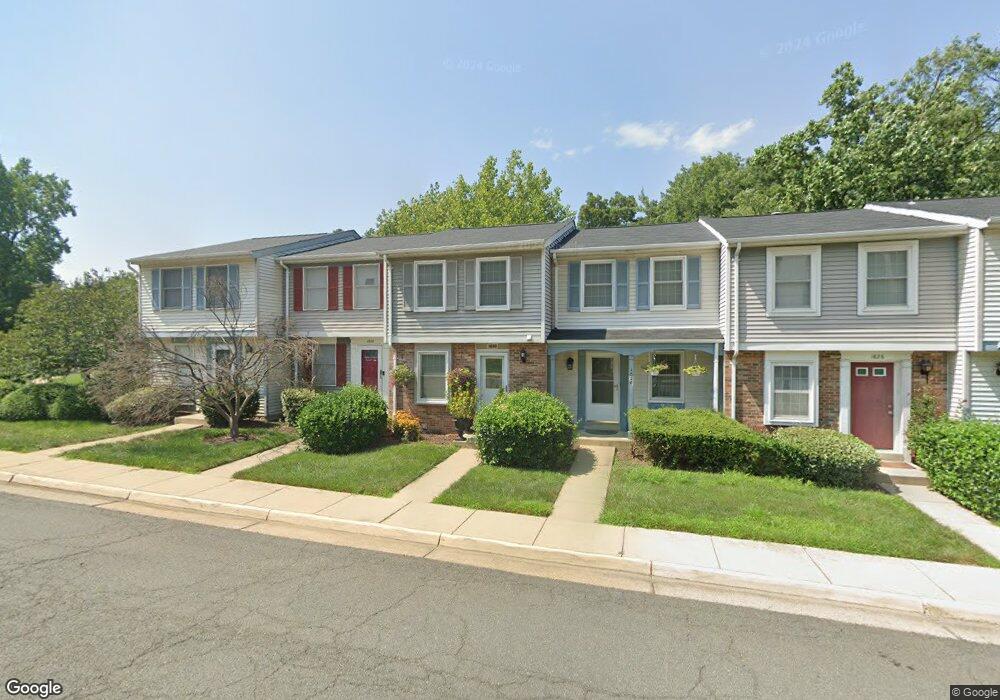
1630 Thenia Place Unit 5-3 Woodbridge, VA 22192
Estimated Value: $311,000 - $363,000
2
Beds
2
Baths
900
Sq Ft
$368/Sq Ft
Est. Value
About This Home
This home is located at 1630 Thenia Place Unit 5-3, Woodbridge, VA 22192 and is currently estimated at $331,290, approximately $368 per square foot. 1630 Thenia Place Unit 5-3 is a home located in Prince William County with nearby schools including Occoquan Elementary School, Fred M. Lynn Middle School, and Woodbridge High School.
Ownership History
Date
Name
Owned For
Owner Type
Purchase Details
Closed on
Sep 7, 2018
Sold by
Castro Elsa and Larin Rene
Bought by
Bentiez Elmer M and Villatoro Merlin Elizabeth
Current Estimated Value
Purchase Details
Closed on
Jun 30, 2011
Sold by
Secretary Of Housing & Urban Development
Bought by
Castro Elsa and Larin Rene
Home Financials for this Owner
Home Financials are based on the most recent Mortgage that was taken out on this home.
Original Mortgage
$116,958
Interest Rate
4.75%
Mortgage Type
FHA
Purchase Details
Closed on
Feb 18, 2011
Sold by
Edwards Phyllis Elaine
Bought by
Secretary Of Housing & Urban Development
Purchase Details
Closed on
Jan 14, 2005
Sold by
Kreutzer Thomas
Bought by
Edwards Phyllis
Home Financials for this Owner
Home Financials are based on the most recent Mortgage that was taken out on this home.
Original Mortgage
$136,400
Interest Rate
5.81%
Mortgage Type
FHA
Create a Home Valuation Report for This Property
The Home Valuation Report is an in-depth analysis detailing your home's value as well as a comparison with similar homes in the area
Home Values in the Area
Average Home Value in this Area
Purchase History
| Date | Buyer | Sale Price | Title Company |
|---|---|---|---|
| Bentiez Elmer M | -- | None Available | |
| Castro Elsa | $120,000 | Lawyers Advantage Title Grou | |
| Secretary Of Housing & Urban Development | $146,967 | None Available | |
| Edwards Phyllis | $205,000 | -- |
Source: Public Records
Mortgage History
| Date | Status | Borrower | Loan Amount |
|---|---|---|---|
| Previous Owner | Castro Elsa | $116,958 | |
| Previous Owner | Edwards Phyllis | $136,400 |
Source: Public Records
Tax History Compared to Growth
Tax History
| Year | Tax Paid | Tax Assessment Tax Assessment Total Assessment is a certain percentage of the fair market value that is determined by local assessors to be the total taxable value of land and additions on the property. | Land | Improvement |
|---|---|---|---|---|
| 2025 | $3,018 | $320,700 | $79,200 | $241,500 |
| 2024 | $3,018 | $303,500 | $74,700 | $228,800 |
| 2023 | $2,635 | $253,200 | $62,100 | $191,100 |
| 2022 | $2,596 | $234,400 | $62,100 | $172,300 |
| 2021 | $2,662 | $215,900 | $62,100 | $153,800 |
| 2020 | $3,226 | $208,100 | $54,600 | $153,500 |
| 2019 | $2,945 | $190,000 | $60,300 | $129,700 |
| 2018 | $2,161 | $179,000 | $56,400 | $122,600 |
| 2017 | $2,293 | $183,700 | $57,600 | $126,100 |
| 2016 | $2,139 | $172,600 | $53,800 | $118,800 |
| 2015 | $1,776 | $154,900 | $48,000 | $106,900 |
| 2014 | $1,776 | $139,200 | $42,900 | $96,300 |
Source: Public Records
Map
Nearby Homes
- 1652 Thenia Place
- 1650 Devil Ln
- 12994 Abner Ave Unit 64
- 1501 Devils Reach Rd
- 1503 Cecilia Ct
- 13200 Conrad Ct
- 12824 Cara Dr
- 1575 Renate Dr
- 13000 Tory Loop
- 1600 Renate Dr Unit 302
- 1602 Renate Dr Unit 302
- 1602 Renate Dr Unit 303
- 13176 Occoquan Rd
- 1550 Renate Dr Unit 101
- 12753 Dara Dr Unit 202
- 12705 Dara Dr Unit 301
- 12703 Dara Dr Unit 302
- 12701 Dara Dr Unit 303
- 12766 Captains Cove
- 12703 Lotte Dr Unit 102
- 1630 Thenia Place
- 1632 Thenia Place
- 1628 Thenia Place
- 1634 Thenia Place Unit 5-1
- 1634 Thenia Place
- 1626 Thenia Place
- 1626 Thenia Place Unit 5
- 1624 Thenia Place
- 1624 Thenia Place Unit 5
- 1624 Thenia Place Unit 5-6
- 1636 Thenia Place Unit 4-6
- 1638 Thenia Place
- 1640 Thenia Place Unit 4
- 1640 Thenia Place Unit 4-4
- 1642 Thenia Place Unit 4-3
- 1642 Thenia Place
- 1640 Devil Ln Unit 7
- 1640 Devil Ln
- 1638 Devil Ln Unit 75
- 1638 Devil Ln Unit 7