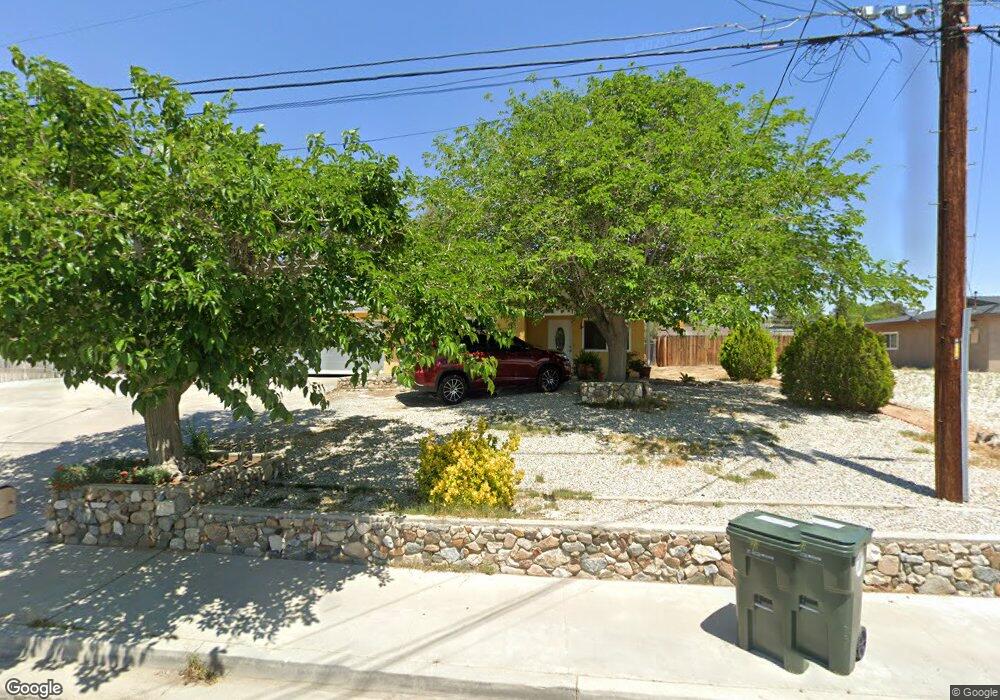
16300 Midway St Victorville, CA 92395
Estimated Value: $314,000 - $350,000
3
Beds
2
Baths
1,155
Sq Ft
$288/Sq Ft
Est. Value
About This Home
This home is located at 16300 Midway St, Victorville, CA 92395 and is currently estimated at $332,311, approximately $287 per square foot. 16300 Midway St is a home located in San Bernardino County with nearby schools including Del Rey Elementary School, Green Tree East Elementary School, and Lakeview Leadership Academy.
Ownership History
Date
Name
Owned For
Owner Type
Purchase Details
Closed on
Oct 21, 2021
Sold by
Sandate Hernandez Jose A and Garcia Reza Elsa
Bought by
Sandate Hernandez Jose A and Garcia Reza Elsa
Current Estimated Value
Purchase Details
Closed on
Apr 17, 2017
Sold by
Appletrees Appleseeds Properties Llc
Bought by
Hernandez Jose A Sandate and Garcia Reza Elsa
Home Financials for this Owner
Home Financials are based on the most recent Mortgage that was taken out on this home.
Original Mortgage
$166,920
Outstanding Balance
$139,054
Interest Rate
4.25%
Mortgage Type
FHA
Estimated Equity
$193,257
Purchase Details
Closed on
Apr 30, 2010
Sold by
Serrano Penny
Bought by
Appletrees Appleseeds Properties Llc
Create a Home Valuation Report for This Property
The Home Valuation Report is an in-depth analysis detailing your home's value as well as a comparison with similar homes in the area
Home Values in the Area
Average Home Value in this Area
Purchase History
| Date | Buyer | Sale Price | Title Company |
|---|---|---|---|
| Sandate Hernandez Jose A | -- | None Available | |
| Hernandez Jose A Sandate | $170,000 | Stewart Title Company | |
| Appletrees Appleseeds Properties Llc | $60,000 | Chicago Title Company |
Source: Public Records
Mortgage History
| Date | Status | Borrower | Loan Amount |
|---|---|---|---|
| Open | Hernandez Jose A Sandate | $166,920 |
Source: Public Records
Tax History Compared to Growth
Tax History
| Year | Tax Paid | Tax Assessment Tax Assessment Total Assessment is a certain percentage of the fair market value that is determined by local assessors to be the total taxable value of land and additions on the property. | Land | Improvement |
|---|---|---|---|---|
| 2025 | $2,327 | $197,300 | $39,461 | $157,839 |
| 2024 | $2,327 | $193,431 | $38,687 | $154,744 |
| 2023 | $2,304 | $189,638 | $37,928 | $151,710 |
| 2022 | $2,265 | $185,919 | $37,184 | $148,735 |
| 2021 | $2,145 | $182,274 | $36,455 | $145,819 |
| 2020 | $2,106 | $180,405 | $36,081 | $144,324 |
| 2019 | $2,069 | $176,868 | $35,374 | $141,494 |
| 2018 | $2,203 | $173,400 | $34,680 | $138,720 |
| 2017 | $889 | $66,733 | $13,347 | $53,386 |
| 2016 | $871 | $65,424 | $13,085 | $52,339 |
| 2015 | $841 | $64,441 | $12,888 | $51,553 |
| 2014 | $825 | $63,179 | $12,636 | $50,543 |
Source: Public Records
Map
Nearby Homes
- 16322 Midway St
- 16312 Molino Dr
- 16403 Seneca Rd
- 0 Molino Dr Unit HD25026364
- 16333 Molino Dr
- 16350 Desert Knoll Dr
- 16286 Cabrillo Dr
- 16138 Lorene Dr
- 16470 Cabrillo Dr
- 16340 Villa Dr
- 0 City View Dr Unit HD25142391
- 14299 La Paz Dr Unit 32
- 14299 La Paz Dr Unit 40
- 14299 La Paz Dr Unit 6
- 14703 Mesa Dr
- 14385 Cactus Dr
- 14375 Cactus Dr
- 16321 Pebble Beach
- 14172 La Paz Dr
- 0 Rodeo Dr
- 16288 Midway St
- 16306 Midway St
- 16291 Lorene Dr
- 16305 Lorene Dr
- 16274 Midway St
- 16275 Lorene Dr
- 16295 Midway St
- 16307 Midway St
- 16285 Midway St
- 16317 Lorene Dr
- 16275 Midway St
- 16262 Midway St
- 16265 Midway St
- 16323 Midway St
- 16259 Lorene Dr
- 16336 Midway St
- 16333 Lorene Dr Unit 1
- 16333 Lorene Dr
- 16254 Midway St
- 16263 Midway St