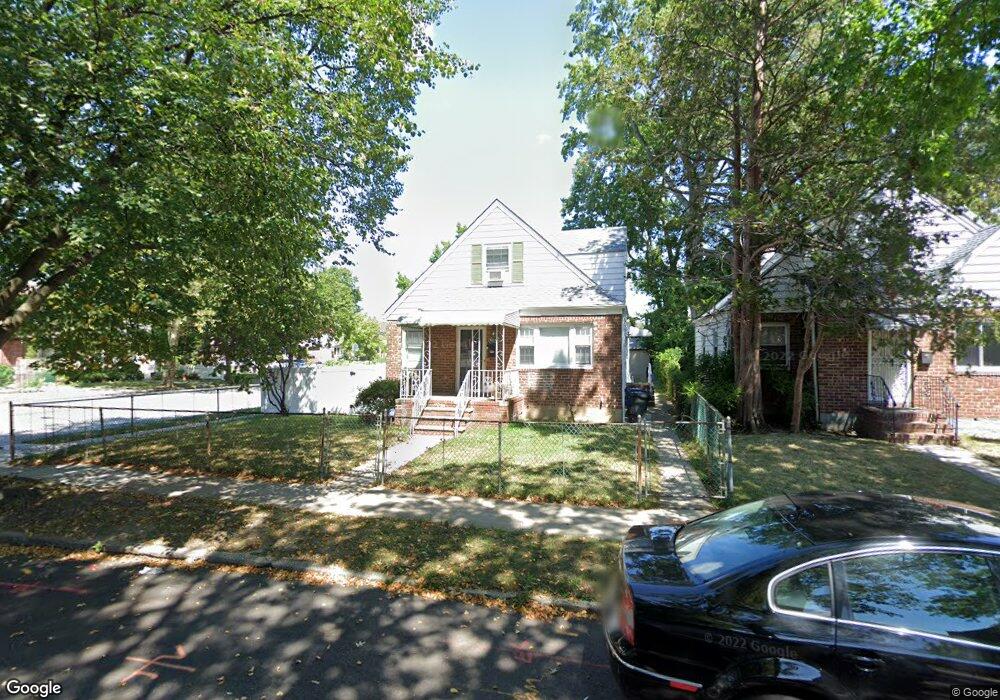
16303 21st Ave Whitestone, NY 11357
Clearview NeighborhoodEstimated Value: $973,000 - $1,215,000
--
Bed
--
Bath
1,192
Sq Ft
$896/Sq Ft
Est. Value
About This Home
This home is located at 16303 21st Ave, Whitestone, NY 11357 and is currently estimated at $1,067,902, approximately $895 per square foot. 16303 21st Ave is a home located in Queens County with nearby schools including P.S. 184 Flushing Manor, J.H.S. 194 William Carr, and Bayside High School.
Ownership History
Date
Name
Owned For
Owner Type
Purchase Details
Closed on
Sep 18, 2020
Sold by
Oliveira Jorge and Oliveira Maria
Bought by
Liang Shou Yong
Current Estimated Value
Home Financials for this Owner
Home Financials are based on the most recent Mortgage that was taken out on this home.
Original Mortgage
$450,000
Outstanding Balance
$399,345
Interest Rate
2.9%
Mortgage Type
New Conventional
Estimated Equity
$668,557
Purchase Details
Closed on
Aug 28, 2007
Sold by
Tyler Robert J
Bought by
Oliveira Jorge and Oliveira Maria
Purchase Details
Closed on
Jun 17, 2002
Sold by
Tylor Robert J and Tyler Harold A
Bought by
Tyler Robert J
Create a Home Valuation Report for This Property
The Home Valuation Report is an in-depth analysis detailing your home's value as well as a comparison with similar homes in the area
Home Values in the Area
Average Home Value in this Area
Purchase History
| Date | Buyer | Sale Price | Title Company |
|---|---|---|---|
| Liang Shou Yong | $845,000 | -- | |
| Oliveira Jorge | -- | -- | |
| Oliveira Jorge | -- | -- | |
| Tyler Robert J | -- | -- | |
| Tyler Robert J | -- | -- |
Source: Public Records
Mortgage History
| Date | Status | Borrower | Loan Amount |
|---|---|---|---|
| Open | Liang Shou Yong | $450,000 | |
| Closed | Oliveira Jorge | $0 |
Source: Public Records
Tax History Compared to Growth
Tax History
| Year | Tax Paid | Tax Assessment Tax Assessment Total Assessment is a certain percentage of the fair market value that is determined by local assessors to be the total taxable value of land and additions on the property. | Land | Improvement |
|---|---|---|---|---|
| 2025 | $9,524 | $49,517 | $11,564 | $37,953 |
| 2024 | $9,524 | $47,416 | $11,791 | $35,625 |
| 2023 | $9,016 | $44,887 | $10,451 | $34,436 |
| 2022 | $8,669 | $56,160 | $14,040 | $42,120 |
| 2021 | $8,686 | $60,060 | $14,040 | $46,020 |
| 2020 | $8,734 | $52,800 | $14,040 | $38,760 |
| 2019 | $8,266 | $51,900 | $14,040 | $37,860 |
| 2018 | $7,625 | $37,406 | $12,891 | $24,515 |
| 2017 | $7,377 | $36,187 | $11,977 | $24,210 |
| 2016 | $6,876 | $36,187 | $11,977 | $24,210 |
| 2015 | $4,117 | $34,387 | $12,610 | $21,777 |
| 2014 | $4,117 | $32,928 | $14,012 | $18,916 |
Source: Public Records
Map
Nearby Homes
- 163-28 20th Rd
- 163-39 21st Ave
- 163-32 20th Ave
- 16337 20th Ave
- 163-40 19th Ave
- 163-61 20th Ave
- 160-54 Willets Point Blvd Unit 4-206
- 17-72 166th St Unit UPPER
- 16366 23rd Ave
- 163- 8 Willets Point Blvd Unit Lower
- 160-19 24th Ave
- 1745 160th St Unit 5-65
- 160-36 24th Ave
- 163-56 17th Ave Unit 4-323
- 24-31 Francis Lewis Blvd
- 166-51 20th Rd
- 17-39 166th St Unit 3-68
- 163-43 Willets Point Blvd Unit 5-172
- 157-33 22nd Ave
- 166-36 23rd Ave
- 163-03 21st Ave
- 16303 21st Ave
- 16307 21st Ave
- 16311 21st Ave
- 163-19 21 Ave
- 16304 20th Rd
- 16308 20th Rd
- 16315 21st Ave
- 16312 20th Rd
- 163-04 20 Rd
- 163-04 20th Rd
- 2046 163rd St
- 2042 163rd St Unit 1
- 2042 163rd St
- 2038 163rd St
- 16316 20th Rd
- 2042 163rd St
- 16319 21st Ave
- 21-10 163rd St
- 21-10 163rd St Unit 3