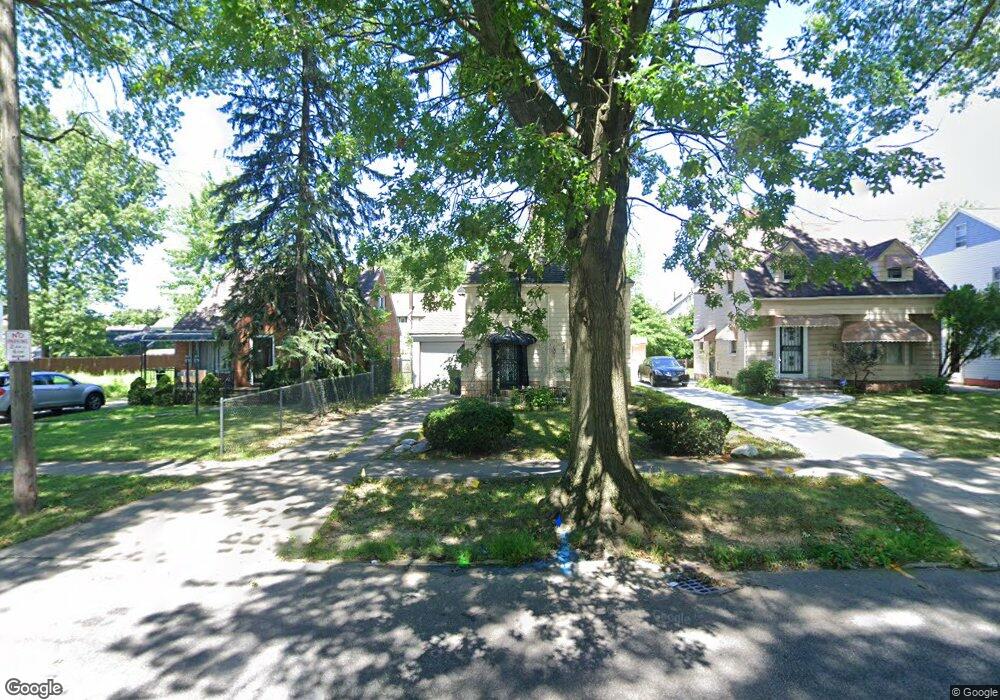
16305 Invermere Ave Cleveland, OH 44128
Lee-Miles NeighborhoodEstimated Value: $95,808 - $129,000
3
Beds
1
Bath
1,293
Sq Ft
$86/Sq Ft
Est. Value
About This Home
This home is located at 16305 Invermere Ave, Cleveland, OH 44128 and is currently estimated at $111,452, approximately $86 per square foot. 16305 Invermere Ave is a home located in Cuyahoga County with nearby schools including Adlai Stevenson School, Andrew J. Rickoff School, and Bolton.
Ownership History
Date
Name
Owned For
Owner Type
Purchase Details
Closed on
Jun 16, 2015
Sold by
Elder Ericka and Elder Jeremiah
Bought by
Sowell Tanya M
Current Estimated Value
Purchase Details
Closed on
Jun 15, 2015
Sold by
Byarse Anthony
Bought by
Sowell Tanya M
Purchase Details
Closed on
Jun 8, 2015
Sold by
Childress April L and Childress Michael L
Bought by
Sowell Tanya M
Purchase Details
Closed on
May 23, 2015
Sold by
Sowell Kevin
Bought by
Sowell Tanya M
Purchase Details
Closed on
May 13, 2015
Sold by
Biggs Patersa
Bought by
Sowell Tanya M
Purchase Details
Closed on
Apr 27, 2015
Sold by
Sowell Maria A
Bought by
Sowell Tanya M
Purchase Details
Closed on
Sep 24, 1981
Sold by
Cook Billy Ray
Bought by
Billy Ray Cook
Purchase Details
Closed on
Apr 28, 1980
Sold by
Starks Rozella Louise
Bought by
Cook Billy Ray
Purchase Details
Closed on
Jul 31, 1978
Sold by
Starks Charles C and Starks Rozella L
Bought by
Starks Rozella Louise
Purchase Details
Closed on
Jan 1, 1975
Bought by
Starks Charles C and Starks Rozella L
Create a Home Valuation Report for This Property
The Home Valuation Report is an in-depth analysis detailing your home's value as well as a comparison with similar homes in the area
Home Values in the Area
Average Home Value in this Area
Purchase History
| Date | Buyer | Sale Price | Title Company |
|---|---|---|---|
| Sowell Tanya M | -- | None Available | |
| Sowell Tanya M | -- | None Available | |
| Sowell Tanya M | -- | None Available | |
| Sowell Tanya M | -- | None Available | |
| Sowell Tanya M | -- | None Available | |
| Sowell Tanya M | -- | None Available | |
| Billy Ray Cook | -- | -- | |
| Cook Billy Ray | $30,000 | -- | |
| Starks Rozella Louise | -- | -- | |
| Starks Charles C | -- | -- |
Source: Public Records
Tax History Compared to Growth
Tax History
| Year | Tax Paid | Tax Assessment Tax Assessment Total Assessment is a certain percentage of the fair market value that is determined by local assessors to be the total taxable value of land and additions on the property. | Land | Improvement |
|---|---|---|---|---|
| 2024 | $1,650 | $34,965 | $7,700 | $27,265 |
| 2023 | $1,137 | $24,160 | $6,900 | $17,260 |
| 2022 | $1,278 | $24,150 | $6,895 | $17,255 |
| 2021 | $1,150 | $24,150 | $6,900 | $17,260 |
| 2020 | $1,025 | $20,620 | $5,880 | $14,740 |
| 2019 | $948 | $58,900 | $16,800 | $42,100 |
| 2018 | $945 | $20,620 | $5,880 | $14,740 |
| 2017 | $979 | $20,620 | $7,280 | $13,340 |
| 2016 | $1,730 | $20,620 | $7,280 | $13,340 |
| 2015 | $1,729 | $20,620 | $7,280 | $13,340 |
| 2014 | $940 | $20,200 | $7,140 | $13,060 |
Source: Public Records
Map
Nearby Homes
- 16314 Scottsdale Blvd
- 16321 Invermere Ave
- 16204 Invermere Ave
- 16317 Throckley Ave
- 16100 Scottsdale Blvd
- 16004 Throckley Ave
- 3716 Rolliston Rd
- 16805 Scottsdale Blvd
- 3666 Lindholm Rd
- 15618 Scottsdale Blvd
- 3657 Ludgate Rd
- 3693 Pennington Rd
- 3689 Pennington Rd
- 3643 Lindholm Rd
- 3697 Menlo Rd
- 3653 Pennington Rd
- 17008 Throckley Ave
- 3616 Hildana Rd
- 3607 Hildana Rd
- 16702 Glendale Ave
- 16309 Invermere Ave
- 16221 Invermere Ave
- 16313 Invermere Ave
- 16217 Invermere Ave
- 16317 Invermere Ave
- 16316 Scottsdale Blvd
- 16312 Scottsdale Blvd
- 16320 Scottsdale Blvd
- 16310 Scottsdale Blvd
- 16213 Invermere Ave
- 16400 Scottsdale Blvd
- 16302 Scottsdale Blvd
- 16306 Invermere Ave
- 16300 Invermere Ave
- 16308 Invermere Ave
- 16401 Invermere Ave
- 16209 Invermere Ave
- 16216 Scottsdale Blvd
- 16220 Invermere Ave
- 16312 Invermere Ave