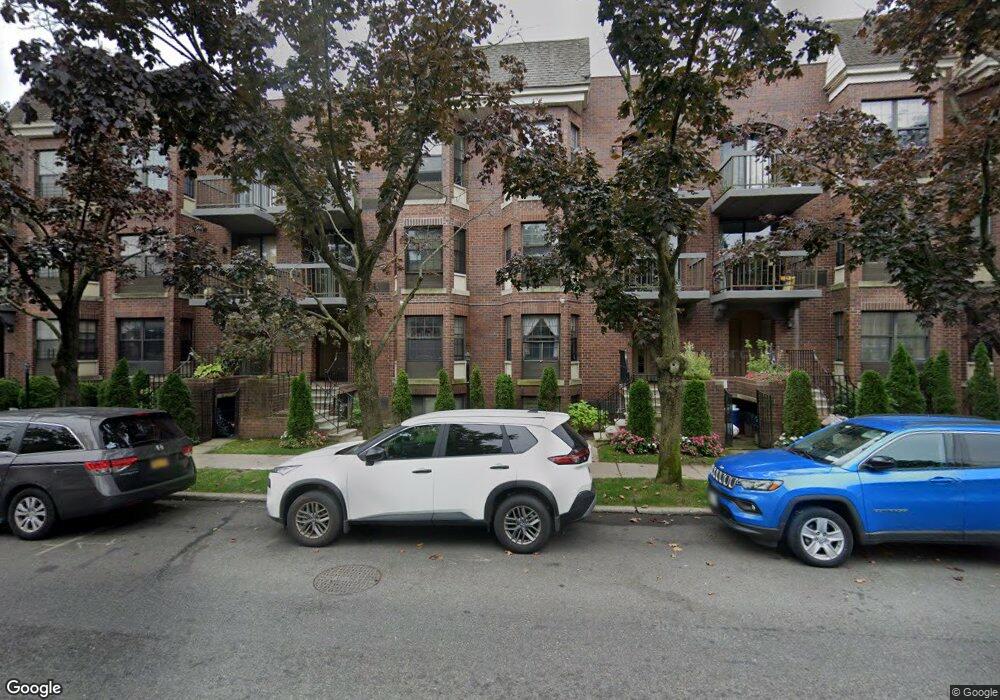
16308 71st Ave Unit 3Fl Fresh Meadows, NY 11365
Pomonok NeighborhoodEstimated Value: $701,000 - $708,000
3
Beds
2
Baths
1,200
Sq Ft
$587/Sq Ft
Est. Value
About This Home
This home is located at 16308 71st Ave Unit 3Fl, Fresh Meadows, NY 11365 and is currently estimated at $704,227, approximately $586 per square foot. 16308 71st Ave Unit 3Fl is a home located in Queens County with nearby schools including I.S. 250 - The Robert F. Kennedy Community Middle School.
Ownership History
Date
Name
Owned For
Owner Type
Purchase Details
Closed on
Dec 18, 2024
Sold by
Tso Clement
Bought by
Law Kwok Leung
Current Estimated Value
Purchase Details
Closed on
Jan 22, 2020
Sold by
Pang Chiu Yan and Wong Lui Hung
Bought by
Tso Clement
Purchase Details
Closed on
May 12, 2016
Sold by
Lu Weicheng
Bought by
Pang Chiu Yan and Wong Lui Hung
Home Financials for this Owner
Home Financials are based on the most recent Mortgage that was taken out on this home.
Original Mortgage
$397,500
Interest Rate
3.59%
Mortgage Type
New Conventional
Purchase Details
Closed on
Jun 9, 2011
Sold by
Kantius Julia
Bought by
Lu Weicheng
Purchase Details
Closed on
Dec 2, 2010
Sold by
Kantius Mikhail
Bought by
Kantius Julia
Create a Home Valuation Report for This Property
The Home Valuation Report is an in-depth analysis detailing your home's value as well as a comparison with similar homes in the area
Home Values in the Area
Average Home Value in this Area
Purchase History
| Date | Buyer | Sale Price | Title Company |
|---|---|---|---|
| Law Kwok Leung | $700,000 | -- | |
| Tso Clement | $625,000 | -- | |
| Tso Clement | $625,000 | -- | |
| Tso Clement | $625,000 | -- | |
| Pang Chiu Yan | $552,000 | -- | |
| Pang Chiu Yan | $552,000 | -- | |
| Pang Chiu Yan | $552,000 | -- | |
| Lu Weicheng | $440,000 | -- | |
| Lu Weicheng | $440,000 | -- | |
| Kantius Julia | -- | -- |
Source: Public Records
Mortgage History
| Date | Status | Borrower | Loan Amount |
|---|---|---|---|
| Previous Owner | Pang Chiu Yan | $397,500 |
Source: Public Records
Tax History Compared to Growth
Tax History
| Year | Tax Paid | Tax Assessment Tax Assessment Total Assessment is a certain percentage of the fair market value that is determined by local assessors to be the total taxable value of land and additions on the property. | Land | Improvement |
|---|---|---|---|---|
| 2025 | $5,996 | $30,082 | $621 | $29,461 |
| 2024 | $5,996 | $29,855 | $643 | $29,212 |
| 2023 | $5,657 | $28,165 | $632 | $27,533 |
| 2022 | $5,305 | $41,233 | $993 | $40,240 |
| 2021 | $5,276 | $36,874 | $993 | $35,881 |
| 2020 | $5,306 | $38,126 | $993 | $37,133 |
| 2019 | $5,204 | $39,411 | $993 | $38,418 |
| 2018 | $4,785 | $23,471 | $742 | $22,729 |
| 2017 | $4,214 | $22,143 | $715 | $21,428 |
| 2016 | $3,866 | $22,143 | $715 | $21,428 |
| 2015 | $2,300 | $20,890 | $763 | $20,127 |
| 2014 | $2,300 | $20,733 | $787 | $19,946 |
Source: Public Records
Map
Nearby Homes
- 71-24 163rd St Unit 5A
- 71-34 163rd St Unit 3
- 71-33 162nd St Unit 4B
- 7111 Sutton Place Unit 3
- 7129 Sutton Place Unit 3
- 163-07 72nd Ave Unit 5C
- 163-07 72nd Ave Unit 5A
- 163-07 72nd Ave Unit 2D
- 163-07 72nd Ave Unit 2G
- 163-07 72nd Ave Unit 4E
- 163-07 72nd Ave Unit 2C
- 163-07 72nd Ave Unit 5F
- 163-07 72nd Ave Unit 5b
- 163-07 72nd Ave Unit 2A
- 163-07 72nd Ave Unit 4H
- 71-18 Sutton Place Unit 3
- 72-05 164th St
- 71-28 Sutton Place Unit 3
- 71-37 166th St
- 71-39 166th St
- 16308 71st Ave
- 16308 71st Ave Unit 141
- 16306 71st Ave Unit 1
- 16308 71st Ave
- 16306 71st Ave
- 16308 71st Ave Unit 2
- 16308 71st Ave Unit 3rd Fl
- 16308 71st Ave
- 16306 71st Ave Unit 131
- 16308 71st Ave Unit 141
- 16308 71st Ave Unit 142
- 16306 71st Ave Unit 131
- 16306 71st Ave Unit 1323
- 16308 71st Ave Unit 143
- 16308 71st Ave Unit 3rd Fl
- 16306 71st Ave
- 163-6 71st Ave
- 16310 71st Ave
- 16310 71st Ave
- 16310 71st Ave