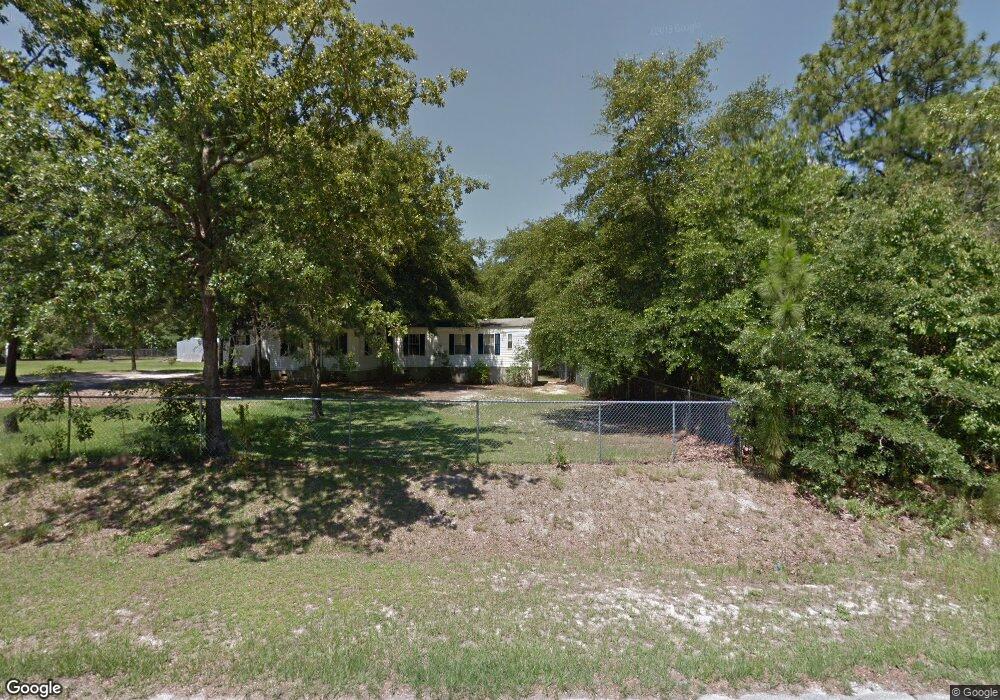
1631 Keron Way Hephzibah, GA 30815
McBean NeighborhoodEstimated Value: $79,946 - $144,000
--
Bed
--
Bath
1,280
Sq Ft
$87/Sq Ft
Est. Value
About This Home
This home is located at 1631 Keron Way, Hephzibah, GA 30815 and is currently estimated at $110,737, approximately $86 per square foot. 1631 Keron Way is a home located in Richmond County with nearby schools including McBean Elementary School, Pine Hill Middle School, and Johnson Magnet.
Ownership History
Date
Name
Owned For
Owner Type
Purchase Details
Closed on
Oct 28, 2002
Sold by
Ehmke Daniel K
Bought by
Ehmke Cheryl A
Current Estimated Value
Home Financials for this Owner
Home Financials are based on the most recent Mortgage that was taken out on this home.
Original Mortgage
$68,400
Outstanding Balance
$28,236
Interest Rate
5.95%
Estimated Equity
$82,501
Purchase Details
Closed on
Dec 5, 1996
Sold by
Ehmke Nina S Estate
Bought by
Ehmke Daniel K
Purchase Details
Closed on
Jul 21, 1995
Sold by
Rascal Enterprises
Bought by
Ehmke Nina S
Purchase Details
Closed on
May 9, 1994
Sold by
Burns Richard A
Bought by
Ehmke Nina S
Purchase Details
Closed on
Jan 31, 1994
Sold by
Ehmke Daniel K
Bought by
Ehmke Nina S
Purchase Details
Closed on
Aug 4, 1992
Sold by
Rascal Enterprises
Bought by
Burns Richard A
Create a Home Valuation Report for This Property
The Home Valuation Report is an in-depth analysis detailing your home's value as well as a comparison with similar homes in the area
Home Values in the Area
Average Home Value in this Area
Purchase History
| Date | Buyer | Sale Price | Title Company |
|---|---|---|---|
| Ehmke Cheryl A | $68,400 | -- | |
| Ehmke Daniel K | -- | -- | |
| Ehmke Nina S | $2,500 | -- | |
| Ehmke Nina S | $9,000 | -- | |
| Ehmke Nina S | -- | -- | |
| Burns Richard A | $8,300 | -- |
Source: Public Records
Mortgage History
| Date | Status | Borrower | Loan Amount |
|---|---|---|---|
| Open | Ehmke Cheryl A | $68,400 |
Source: Public Records
Tax History Compared to Growth
Tax History
| Year | Tax Paid | Tax Assessment Tax Assessment Total Assessment is a certain percentage of the fair market value that is determined by local assessors to be the total taxable value of land and additions on the property. | Land | Improvement |
|---|---|---|---|---|
| 2025 | $880 | $15,282 | $6,000 | $9,282 |
| 2024 | $880 | $14,822 | $6,000 | $8,822 |
| 2023 | $801 | $13,637 | $6,000 | $7,637 |
| 2022 | $832 | $15,594 | $6,000 | $9,594 |
| 2021 | $861 | $15,141 | $6,000 | $9,141 |
| 2020 | $855 | $15,247 | $6,000 | $9,247 |
| 2019 | $755 | $16,116 | $6,000 | $10,116 |
| 2018 | $769 | $16,460 | $6,000 | $10,460 |
| 2017 | $539 | $9,758 | $6,000 | $3,758 |
| 2016 | $544 | $9,908 | $6,000 | $3,908 |
| 2015 | $548 | $10,008 | $6,000 | $4,008 |
| 2014 | $548 | $9,998 | $6,000 | $3,998 |
Source: Public Records
Map
Nearby Homes
- 1515F Hephzibah - McBean Rd
- 1290 Hephzibah - McBean Rd
- 1468 Hephzibah - McBean Rd
- 1436 Hephzibah - McBean Rd Unit 1
- 1436 Hephzibah - McBean Rd
- 5049 Deer Trail Dr
- 1515G Hephzibah - McBean Rd
- 1515H Hephzibah - McBean Rd
- 1515D Hephzibah - McBean Rd
- 1515C Hephzibah - McBean Rd
- 2177 Broome Rd
- 2073 C Broome Rd
- 1515B Hephzibah - McBean Rd
- 2010 McCoy Mill Rd
- 4924 Old Waynesboro Rd
- 4734 Tinley Rd
- 1027 Grindstone Creek Rd
- 4653 Hunters Mill Ct
- 1123 Hephzibah - McBean Rd
- 1106B Hephzibah - McBean Rd
- 4908a Old Waynesboro Rd Rd
- 4908A Old Waynesboro Rd
- 1633 Keron Way
- 1622 Keron Way
- 1620 Keron Way
- 1624 Keron Way
- 4912 Old Waynesboro Rd
- 1621 Keron Way
- 1626 Keron Way
- 1618 Keron Way
- 4914 Old Waynesboro Rd
- 1508 Keron Way
- 1527 Keron Way
- 1627 Keron Way
- 4910 Old Waynesboro Rd
- 1616 Keron Way
- 1614 Keron Way
- 1609 Keron Way
- 1623 Keron Way
- 1617 Keron Way