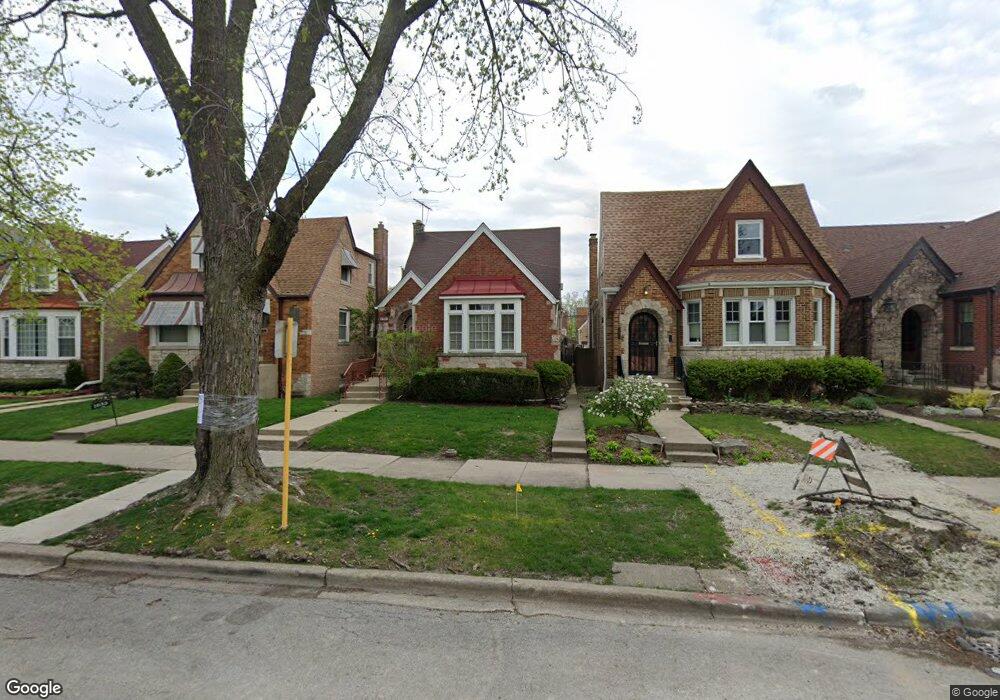
1631 N Rutherford Ave Chicago, IL 60707
Galewood NeighborhoodEstimated Value: $417,546 - $491,000
4
Beds
2
Baths
2,089
Sq Ft
$218/Sq Ft
Est. Value
About This Home
This home is located at 1631 N Rutherford Ave, Chicago, IL 60707 and is currently estimated at $456,387, approximately $218 per square foot. 1631 N Rutherford Ave is a home located in Cook County with nearby schools including Sayre Elementary Language Academy, Steinmetz College Prep, and Acero - Roberto Clemente Elementary School.
Ownership History
Date
Name
Owned For
Owner Type
Purchase Details
Closed on
Oct 11, 2017
Sold by
Bowdry Anna Bell
Bought by
Chicago Title Land Trust Company and Trust Number 8002376054
Current Estimated Value
Purchase Details
Closed on
May 1, 1997
Sold by
Hegger Robert C
Bought by
Bowdry Anna Bell
Home Financials for this Owner
Home Financials are based on the most recent Mortgage that was taken out on this home.
Original Mortgage
$99,400
Interest Rate
8.05%
Purchase Details
Closed on
Jul 23, 1996
Sold by
Borman Deborah L
Bought by
Hegger Robert C
Purchase Details
Closed on
Sep 30, 1993
Sold by
Oshea Eileen T and Coleman Mary E
Bought by
Hegger Robert C and Borman Deborah L
Home Financials for this Owner
Home Financials are based on the most recent Mortgage that was taken out on this home.
Original Mortgage
$136,800
Interest Rate
6.93%
Create a Home Valuation Report for This Property
The Home Valuation Report is an in-depth analysis detailing your home's value as well as a comparison with similar homes in the area
Home Values in the Area
Average Home Value in this Area
Purchase History
| Date | Buyer | Sale Price | Title Company |
|---|---|---|---|
| Chicago Title Land Trust Company | -- | Chicago Title Land Trust Com | |
| Bowdry Anna Bell | $179,500 | -- | |
| Hegger Robert C | -- | -- | |
| Hegger Robert C | $101,333 | -- |
Source: Public Records
Mortgage History
| Date | Status | Borrower | Loan Amount |
|---|---|---|---|
| Previous Owner | Bowdry Anna Bell | $99,400 | |
| Previous Owner | Hegger Robert C | $136,800 |
Source: Public Records
Tax History Compared to Growth
Tax History
| Year | Tax Paid | Tax Assessment Tax Assessment Total Assessment is a certain percentage of the fair market value that is determined by local assessors to be the total taxable value of land and additions on the property. | Land | Improvement |
|---|---|---|---|---|
| 2024 | $3,595 | $37,000 | $11,718 | $25,282 |
| 2023 | $3,615 | $26,000 | $9,450 | $16,550 |
| 2022 | $3,615 | $26,000 | $9,450 | $16,550 |
| 2021 | $3,442 | $26,000 | $9,450 | $16,550 |
| 2020 | $3,666 | $24,825 | $4,725 | $20,100 |
| 2019 | $3,654 | $27,894 | $4,725 | $23,169 |
| 2018 | $3,599 | $27,894 | $4,725 | $23,169 |
| 2017 | $3,854 | $26,959 | $4,158 | $22,801 |
| 2016 | $4,218 | $26,959 | $4,158 | $22,801 |
| 2015 | $4,054 | $26,959 | $4,158 | $22,801 |
| 2014 | $4,020 | $26,055 | $3,780 | $22,275 |
| 2013 | $3,922 | $26,055 | $3,780 | $22,275 |
Source: Public Records
Map
Nearby Homes
- 1639 N Normandy Ave
- 1700 N Natoma Ave
- 1733 N Oak Park Ave
- 1227 N East Ave
- 1600 N New England Ave Unit 4
- 1701 N Newland Ave
- 1130 N Grove Ave
- 1916 N Rutherford Ave
- 1937 N Normandy Ave
- 1104 Fair Oaks Ave
- 1143 Woodbine Ave
- 1941 N New England Ave
- 1221 Edmer Ave
- 1627 N Narragansett Ave
- 1009 N Oak Park Ave
- 925 Linden Ave
- 438 Lenox St
- 1905 N Nordica Ave
- 1122 N Ridgeland Ave
- 1212 N Harvey Ave
- 1633 N Rutherford Ave
- 1627 N Rutherford Ave
- 1625 N Rutherford Ave
- 1637 N Rutherford Ave
- 1639 N Rutherford Ave
- 1621 N Rutherford Ave
- 1619 N Rutherford Ave
- 1643 N Rutherford Ave
- 1630 N Normandy Ave
- 1632 N Normandy Ave
- 1626 N Normandy Ave
- 1645 N Rutherford Ave
- 1624 N Normandy Ave
- 1636 N Normandy Ave
- 1638 N Normandy Ave
- 1649 N Rutherford Ave
- 1618 N Normandy Ave
- 1630 N Rutherford Ave