1631 Queens Branch Rd Rogue River, OR 97537
Estimated Value: $557,993 - $661,000
3
Beds
3
Baths
1,908
Sq Ft
$314/Sq Ft
Est. Value
About This Home
This home is located at 1631 Queens Branch Rd, Rogue River, OR 97537 and is currently estimated at $599,998, approximately $314 per square foot. 1631 Queens Branch Rd is a home located in Jackson County with nearby schools including South Valley Academy, Rogue River Elementary School, and Rogue River Junior/Senior High School.
Ownership History
Date
Name
Owned For
Owner Type
Purchase Details
Closed on
Nov 24, 2003
Sold by
Oregon Dept Of Transportation
Bought by
Gillard John C and Gillard Sande L
Current Estimated Value
Purchase Details
Closed on
Aug 20, 2003
Sold by
Gillard John C and Gillard Sande L
Bought by
Murff Brian K and Murff Pauline R
Home Financials for this Owner
Home Financials are based on the most recent Mortgage that was taken out on this home.
Original Mortgage
$219,680
Interest Rate
5.87%
Mortgage Type
Purchase Money Mortgage
Purchase Details
Closed on
Feb 28, 2003
Sold by
Oregon Department Of Transportation
Bought by
Gillard John C and Gillard Sande L
Home Financials for this Owner
Home Financials are based on the most recent Mortgage that was taken out on this home.
Original Mortgage
$160,400
Interest Rate
7%
Mortgage Type
Land Contract Argmt. Of Sale
Purchase Details
Closed on
Nov 8, 2002
Sold by
Grove Monte J and Grove Inez Joyce
Bought by
Oregon Department Of Transportation
Create a Home Valuation Report for This Property
The Home Valuation Report is an in-depth analysis detailing your home's value as well as a comparison with similar homes in the area
Home Values in the Area
Average Home Value in this Area
Purchase History
| Date | Buyer | Sale Price | Title Company |
|---|---|---|---|
| Gillard John C | $200,500 | -- | |
| Murff Brian K | $274,600 | First American | |
| Gillard John C | $200,500 | -- | |
| Oregon Department Of Transportation | $200,000 | -- |
Source: Public Records
Mortgage History
| Date | Status | Borrower | Loan Amount |
|---|---|---|---|
| Previous Owner | Murff Brian K | $219,680 | |
| Previous Owner | Gillard John C | $160,400 |
Source: Public Records
Tax History Compared to Growth
Tax History
| Year | Tax Paid | Tax Assessment Tax Assessment Total Assessment is a certain percentage of the fair market value that is determined by local assessors to be the total taxable value of land and additions on the property. | Land | Improvement |
|---|---|---|---|---|
| 2025 | $1,890 | $217,770 | $45,120 | $172,650 |
| 2024 | $1,890 | $211,429 | $67,009 | $144,420 |
| 2023 | $1,830 | $205,278 | $65,058 | $140,220 |
| 2022 | $1,790 | $205,278 | $65,058 | $140,220 |
| 2021 | $1,738 | $199,307 | $63,157 | $136,150 |
| 2020 | $1,697 | $193,506 | $61,306 | $132,200 |
| 2019 | $1,656 | $182,407 | $57,787 | $124,620 |
| 2018 | $1,614 | $177,097 | $56,107 | $120,990 |
| 2017 | $1,577 | $177,097 | $56,107 | $120,990 |
| 2016 | $1,538 | $166,949 | $52,889 | $114,060 |
| 2015 | $1,492 | $166,949 | $52,889 | $114,060 |
| 2014 | $1,443 | $157,372 | $49,842 | $107,530 |
Source: Public Records
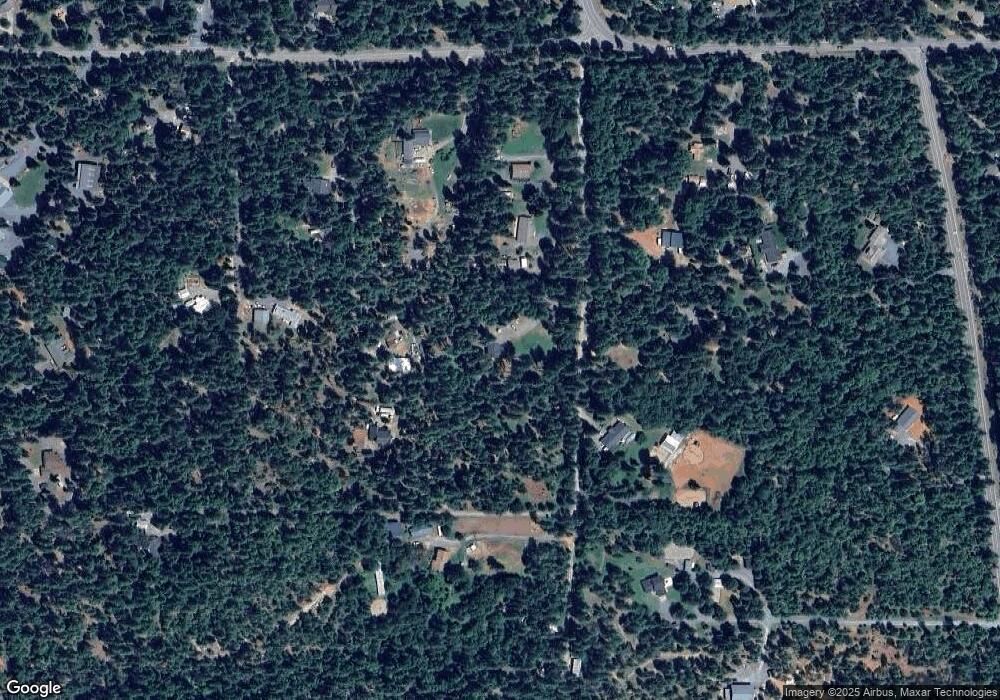
Map
Nearby Homes
- 7435 W Evans Creek Rd
- 7310 W Evans Creek Rd
- 7118 Redthorne Rd
- 835 Minthorne Rd
- 9184 W Evans Creek Rd
- 8797 W Evans Creek Rd
- 255 Queens Branch Rd
- 1205 Pine Grove Rd
- 149 Queens Branch Rd
- 1105 Pine Grove Rd
- 1475 Pleasant Creek Rd
- 6324 E Evans Creek Rd
- 643 Covered Bridge Rd
- 8951 E Evans Creek Rd Unit 14
- 5406 E Evans Creek Rd
- 798 Covered Bridge Rd
- 256 Deruyte Way
- 254 Deruyte Way
- 257 Deruyte Way
- 252 Deruyte Way
- 1627 Queens Branch Rd
- 1650 Queens Branch Rd
- 1638 Queens Branch Rd
- 1825 Queens Branch Rd
- 1635 Queens Branch Rd
- 1695 Queens Branch Rd
- 1765 Queens Branch Rd
- 1545 Queens Branch Rd
- 7729 W Evans Creek Rd
- 1515 Queens Branch Rd
- 1835 Queens Branch Rd
- 1740 Queens Branch Rd
- 1790 Queens Branch Rd
- 1738 Queens Branch Rd
- 7867 W Evans Creek Rd
- 1633 Queens Branch Rd
- 7923 W Evans Creek Rd
- 8021 W Evans Creek Rd
- 1867 Queens Branch Rd
- 1590 Queens Branch Rd