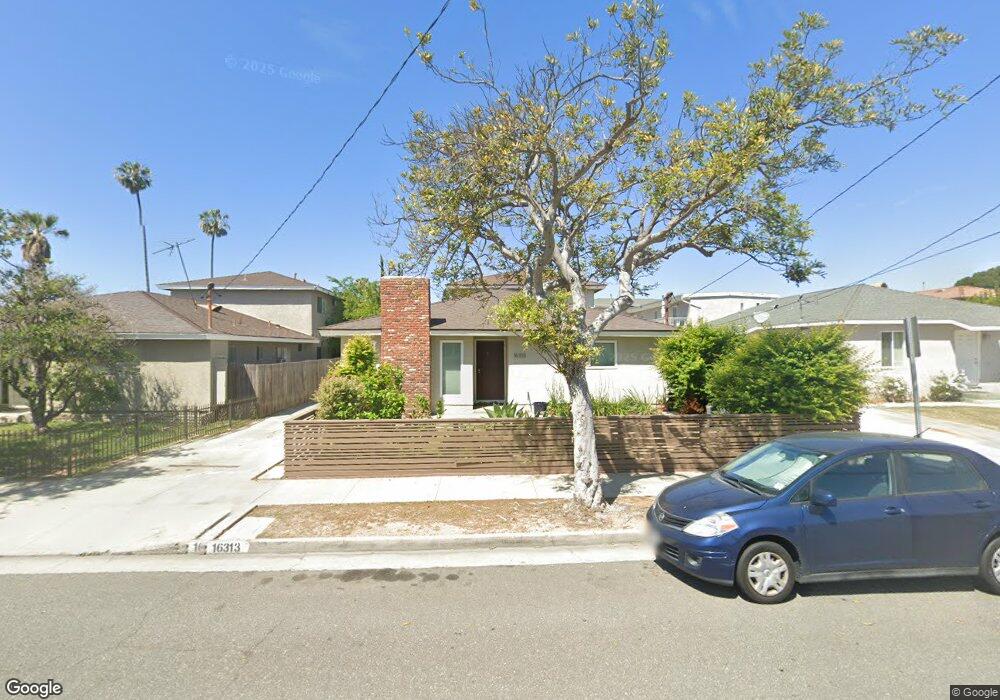
16313 S Saint Andrews Place Gardena, CA 90247
Estimated Value: $1,461,000 - $2,049,000
9
Beds
5
Baths
3,949
Sq Ft
$451/Sq Ft
Est. Value
About This Home
This home is located at 16313 S Saint Andrews Place, Gardena, CA 90247 and is currently estimated at $1,782,009, approximately $451 per square foot. 16313 S Saint Andrews Place is a home located in Los Angeles County with nearby schools including Denker Avenue Elementary School, Robert E. Peary Middle School, and Gardena Senior High School.
Ownership History
Date
Name
Owned For
Owner Type
Purchase Details
Closed on
Mar 2, 2018
Sold by
Watanabe Evan T
Bought by
Watanabe Evan T and Ito Kai A
Current Estimated Value
Purchase Details
Closed on
Mar 22, 2011
Sold by
Sakaguchi Gail A
Bought by
Watanabe Evan T and Ito Kai A
Home Financials for this Owner
Home Financials are based on the most recent Mortgage that was taken out on this home.
Original Mortgage
$517,500
Interest Rate
4.84%
Mortgage Type
New Conventional
Purchase Details
Closed on
Dec 17, 1999
Sold by
Gardena Table Top Inc
Bought by
Sakaguchi Gail A
Home Financials for this Owner
Home Financials are based on the most recent Mortgage that was taken out on this home.
Original Mortgage
$250,000
Interest Rate
8.18%
Create a Home Valuation Report for This Property
The Home Valuation Report is an in-depth analysis detailing your home's value as well as a comparison with similar homes in the area
Home Values in the Area
Average Home Value in this Area
Purchase History
| Date | Buyer | Sale Price | Title Company |
|---|---|---|---|
| Watanabe Evan T | -- | None Available | |
| Watanabe Evan T | $690,000 | Lawyers Title | |
| Sakaguchi Gail A | $430,000 | American Coast Title |
Source: Public Records
Mortgage History
| Date | Status | Borrower | Loan Amount |
|---|---|---|---|
| Previous Owner | Watanabe Evan T | $517,500 | |
| Previous Owner | Sakaguchi Gail A | $250,000 |
Source: Public Records
Tax History Compared to Growth
Tax History
| Year | Tax Paid | Tax Assessment Tax Assessment Total Assessment is a certain percentage of the fair market value that is determined by local assessors to be the total taxable value of land and additions on the property. | Land | Improvement |
|---|---|---|---|---|
| 2025 | $11,327 | $883,999 | $544,495 | $339,504 |
| 2024 | $11,327 | $866,667 | $533,819 | $332,848 |
| 2023 | $11,128 | $849,674 | $523,352 | $326,322 |
| 2022 | $10,589 | $833,015 | $513,091 | $319,924 |
| 2021 | $10,473 | $816,682 | $503,031 | $313,651 |
| 2019 | $10,141 | $792,461 | $488,112 | $304,349 |
| 2018 | $9,925 | $776,924 | $478,542 | $298,382 |
| 2016 | $9,387 | $746,757 | $459,960 | $286,797 |
| 2015 | $9,231 | $735,541 | $453,051 | $282,490 |
| 2014 | $9,235 | $721,134 | $444,177 | $276,957 |
Source: Public Records
Map
Nearby Homes
- 2044 166th St
- 15908 S Manhattan Place
- 15906 S Manhattan Place
- 2072 Redondo Beach Blvd
- 16949 S Western Ave Unit 29B
- 16949 S Western Ave
- 16949 S Western Ave Unit 34
- 2015 W 157th St
- 16008 La Salle Ave Unit 11
- 314 Bridgewater Way Unit 2
- 320 Bridgewater Way Unit 7
- 17024 S Western Ave Unit 28
- 17024 S Western Ave Unit 36
- 15839 Apollo Place
- 15832 Apollo Place
- 16720 S Dalton Ave
- 2501 W Redondo Beach Blvd Unit 311
- 2501 W Redondo Beach Blvd Unit 317
- 2501 W Redondo Beach Blvd Unit 306
- 2605 W 163rd St
- 16313 S Saint Andrews Place Unit 4
- 16313 S Saint Andrews Place Unit 1
- 16309 S Saint Andrews Place
- 16317 S Saint Andrews Place
- 16303 S Saint Andrews Place
- 1903 W Gardena Blvd
- 1907 W Gardena Blvd
- 1917 W Gardena Blvd
- 1921 W Gardena Blvd
- 16227 S St Andrews Place
- 16229 S Saint Andrews Place
- 16231 S Saint Andrews Place
- 16227 S Saint Andrews Place
- 16231 S St Andrews Place
- 16308 Gramercy Place
- 1863 W Gardena Blvd
- 16304 Gramercy Place Unit C
- 16304 Gramercy Place Unit B
- 16304 Gramercy Place Unit A
- 1925 W Gardena Blvd