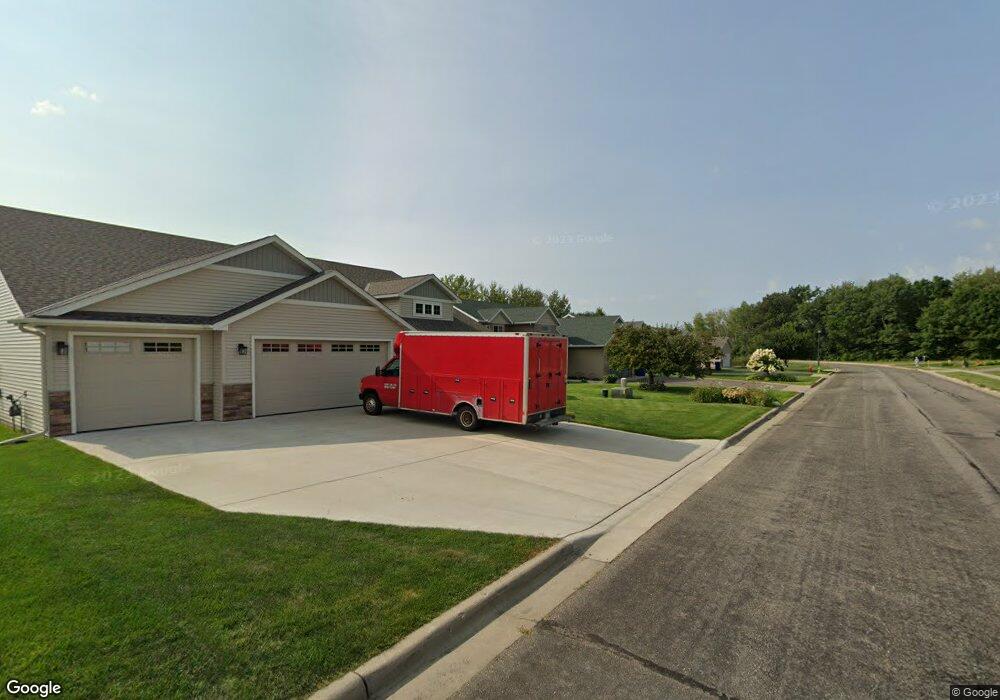
1632 20th Ave NE Sauk Rapids, MN 56379
Estimated Value: $301,094 - $324,000
3
Beds
2
Baths
1,054
Sq Ft
$301/Sq Ft
Est. Value
About This Home
This home is located at 1632 20th Ave NE, Sauk Rapids, MN 56379 and is currently estimated at $317,024, approximately $300 per square foot. 1632 20th Ave NE is a home located in Benton County with nearby schools including Mississippi Heights Elementary School, Sauk Rapids-Rice Middle School, and Sauk Rapids-Rice Senior High School.
Ownership History
Date
Name
Owned For
Owner Type
Purchase Details
Closed on
May 15, 2008
Sold by
Farmers & Merchants State Bank Of Pierz
Bought by
Essery Arthur D and Esseryfitzgibbons Stock Erin E
Current Estimated Value
Purchase Details
Closed on
Apr 21, 2006
Sold by
Dan Robak Construction Llc
Bought by
Essery Arthur D and Fitzgibbons Stock Erin E
Home Financials for this Owner
Home Financials are based on the most recent Mortgage that was taken out on this home.
Original Mortgage
$104,900
Interest Rate
6.42%
Mortgage Type
New Conventional
Purchase Details
Closed on
Nov 28, 2005
Sold by
Jmc Companies Of Mn Inc
Bought by
Dan Robak Construction Llc
Home Financials for this Owner
Home Financials are based on the most recent Mortgage that was taken out on this home.
Original Mortgage
$116,285
Interest Rate
6.13%
Mortgage Type
Construction
Create a Home Valuation Report for This Property
The Home Valuation Report is an in-depth analysis detailing your home's value as well as a comparison with similar homes in the area
Home Values in the Area
Average Home Value in this Area
Purchase History
| Date | Buyer | Sale Price | Title Company |
|---|---|---|---|
| Essery Arthur D | -- | -- | |
| Essery Arthur D | -- | -- | |
| Dan Robak Construction Llc | $49,360 | -- |
Source: Public Records
Mortgage History
| Date | Status | Borrower | Loan Amount |
|---|---|---|---|
| Previous Owner | Essery Arthur D | $104,900 | |
| Previous Owner | Dan Robak Construction Llc | $116,285 |
Source: Public Records
Tax History Compared to Growth
Tax History
| Year | Tax Paid | Tax Assessment Tax Assessment Total Assessment is a certain percentage of the fair market value that is determined by local assessors to be the total taxable value of land and additions on the property. | Land | Improvement |
|---|---|---|---|---|
| 2025 | $3,520 | $293,100 | $36,300 | $256,800 |
| 2024 | $3,484 | $290,500 | $36,300 | $254,200 |
| 2023 | $3,364 | $294,900 | $36,300 | $258,600 |
| 2022 | $3,110 | $262,400 | $36,300 | $226,100 |
| 2021 | $2,792 | $224,300 | $33,800 | $190,500 |
| 2018 | $2,410 | $160,900 | $27,702 | $133,198 |
| 2017 | $2,410 | $147,800 | $27,245 | $120,555 |
| 2016 | $2,284 | $164,500 | $31,300 | $133,200 |
| 2015 | $2,298 | $126,500 | $26,361 | $100,139 |
| 2014 | -- | $120,800 | $26,076 | $94,724 |
| 2013 | -- | $123,200 | $26,197 | $97,003 |
Source: Public Records
Map
Nearby Homes
- 1526 Prairie View Ln NE
- xxx Lot 3
- 1294 Stone Ridge Rd
- 1664 Payton Ct NE
- 55xx Mayhew Lake Rd NE
- 1424 Hillside Ct
- 1408 10th St NE
- xxx Lot 2
- tbd 25th Ave NE
- TBD Lot D Mayhew Lake Rd NE
- 2148 Morningside Dr NE
- 1930 Prospect Dr NE
- 1000 10th Ave NE
- 970 Golden Spike Rd NE
- 880 Golden Spike Rd NE
- 1 Skyview Dr
- XXXX Golden Spike Rd NE
- 1355 Onyx Way NE
- 1021 5th St S
- 100 9th Ave S
- 1622 20th Ave NE
- 1642 20th Ave NE
- 1652 20th Ave NE
- 1598 20th Ave NE
- 2016 20th Ave NE
- 2016 NE 20th-Avenue-
- 1662 20th Ave NE
- 1597 20th Ave NE
- 1663 20th Ave NE
- 1672 20th Ave NE
- 1641 20th Ave NE
- 1667 20th Ave NE
- 1671 20th Ave NE
- 1682 20th Ave NE
- 1675 20th Ave NE
- 1679 20th Ave NE
- 1683 20th Ave NE
- 1687 20th Ave NE
- 1954 Peach Dr NE
- 1688 20th Ave NE