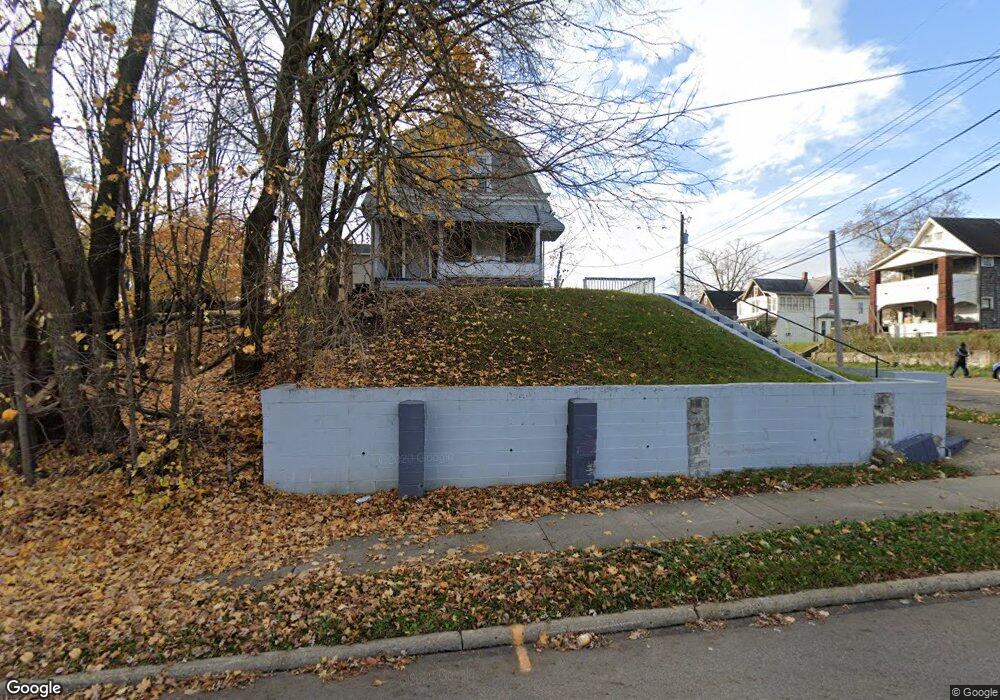
1632 6th St SW Canton, OH 44706
Southwest Canton NeighborhoodEstimated Value: $61,000 - $107,208
2
Beds
1
Bath
1,320
Sq Ft
$66/Sq Ft
Est. Value
About This Home
This home is located at 1632 6th St SW, Canton, OH 44706 and is currently estimated at $87,052, approximately $65 per square foot. 1632 6th St SW is a home located in Stark County with nearby schools including Early Learning Center @ Schreiber, Cedar Elementary School, and McGregor Elementary School.
Ownership History
Date
Name
Owned For
Owner Type
Purchase Details
Closed on
Aug 15, 2022
Sold by
Premier Homes Inc
Bought by
Jet Properties Of Ohio Llc
Current Estimated Value
Home Financials for this Owner
Home Financials are based on the most recent Mortgage that was taken out on this home.
Original Mortgage
$272,800
Outstanding Balance
$247,096
Interest Rate
5.3%
Mortgage Type
Credit Line Revolving
Estimated Equity
-$160,044
Purchase Details
Closed on
Feb 18, 2020
Sold by
Beachy Robert
Bought by
Premier Homes Inc
Home Financials for this Owner
Home Financials are based on the most recent Mortgage that was taken out on this home.
Original Mortgage
$42,075
Interest Rate
3.72%
Mortgage Type
New Conventional
Purchase Details
Closed on
Jan 16, 2020
Sold by
Niesz William J and Niesz Yvonna D
Bought by
Beachy Robert
Home Financials for this Owner
Home Financials are based on the most recent Mortgage that was taken out on this home.
Original Mortgage
$42,075
Interest Rate
3.72%
Mortgage Type
New Conventional
Create a Home Valuation Report for This Property
The Home Valuation Report is an in-depth analysis detailing your home's value as well as a comparison with similar homes in the area
Home Values in the Area
Average Home Value in this Area
Purchase History
| Date | Buyer | Sale Price | Title Company |
|---|---|---|---|
| Jet Properties Of Ohio Llc | $341,000 | Pfendler Christopher C | |
| Premier Homes Inc | $45,500 | None Available | |
| Beachy Robert | $25,000 | None Available |
Source: Public Records
Mortgage History
| Date | Status | Borrower | Loan Amount |
|---|---|---|---|
| Open | Jet Properties Of Ohio Llc | $272,800 | |
| Previous Owner | Premier Homes Inc | $42,075 |
Source: Public Records
Tax History Compared to Growth
Tax History
| Year | Tax Paid | Tax Assessment Tax Assessment Total Assessment is a certain percentage of the fair market value that is determined by local assessors to be the total taxable value of land and additions on the property. | Land | Improvement |
|---|---|---|---|---|
| 2025 | -- | $25,240 | $5,430 | $19,810 |
| 2024 | -- | $25,240 | $5,430 | $19,810 |
| 2023 | $691 | $11,310 | $2,630 | $8,680 |
| 2022 | $675 | $11,310 | $2,630 | $8,680 |
| 2021 | $682 | $11,310 | $2,630 | $8,680 |
| 2020 | $604 | $8,970 | $2,210 | $6,760 |
| 2019 | $277 | $8,970 | $2,210 | $6,760 |
| 2018 | $533 | $8,970 | $2,210 | $6,760 |
| 2017 | $549 | $8,410 | $2,280 | $6,130 |
| 2016 | $551 | $8,410 | $2,280 | $6,130 |
| 2015 | $555 | $8,410 | $2,280 | $6,130 |
| 2014 | $652 | $9,310 | $2,520 | $6,790 |
| 2013 | $316 | $9,310 | $2,520 | $6,790 |
Source: Public Records
Map
Nearby Homes
- 719 Prospect Ave SW
- 646 Dueber Ave SW
- 817 Prospect Ave SW
- 633 Park Ave SW
- 631 Greenfield Ave SW
- 1017 Clinton Ave SW
- 1016 Clinton Ave SW
- 202 Lincoln Ave NW
- 201 Park Ave NW
- 1021 Greenfield Ave SW
- 1001 Harrison Ave SW
- 2310 7th St SW
- 241 Raymont Ct SW
- 435 Hazlett Ave NW
- 1215 Dueber Ave SW
- 1219 Dueber Ave SW
- 931 Smith Ave SW
- 1111 2nd St NW
- 2411 Strasser Place SW
- 1024 3rd St NW
- 608 Prospect Ave SW
- 612 Prospect Ave SW
- 601 Prospect Ave SW
- 614 Prospect Ave SW
- 609 Prospect Ave SW
- 618 Prospect Ave SW
- 611 Prospect Ave SW
- 615 Prospect Ave SW
- 622 Prospect Ave SW
- 619 Prospect Ave SW
- 615 Camden Ave SW
- 626 Prospect Ave SW
- 623 Prospect Ave SW
- 1707 6th St SW
- 630 Prospect Ave SW
- 633 Prospect Ave SW
- 634 Prospect Ave SW
- 602 Garfield Ave SW
- 616 Garfield Ave SW
- 622 Garfield Ave SW