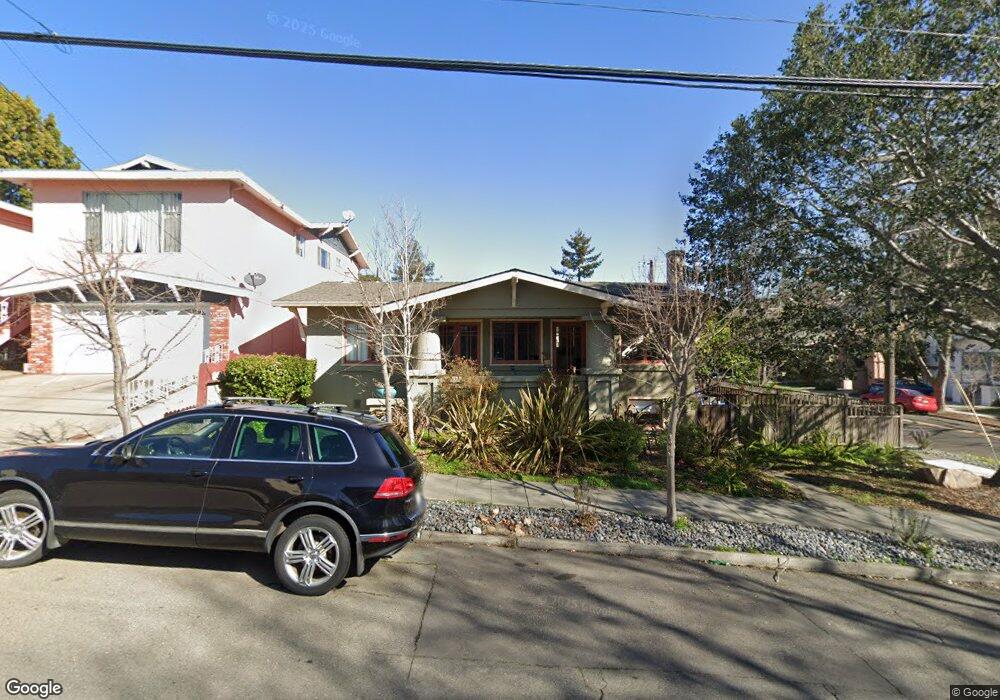
1632 E 38th St Oakland, CA 94602
Glenview NeighborhoodEstimated Value: $1,036,000 - $1,264,000
3
Beds
2
Baths
1,670
Sq Ft
$692/Sq Ft
Est. Value
About This Home
This home is located at 1632 E 38th St, Oakland, CA 94602 and is currently estimated at $1,155,235, approximately $691 per square foot. 1632 E 38th St is a home located in Alameda County with nearby schools including Glenview Elementary School, Edna Brewer Middle School, and Oakland High School.
Ownership History
Date
Name
Owned For
Owner Type
Purchase Details
Closed on
Aug 26, 2012
Sold by
Brown Christopher and Brown Christian
Bought by
Williams Gary S and Williams Rosemary P
Current Estimated Value
Home Financials for this Owner
Home Financials are based on the most recent Mortgage that was taken out on this home.
Original Mortgage
$608,000
Outstanding Balance
$419,120
Interest Rate
3.49%
Mortgage Type
New Conventional
Estimated Equity
$736,115
Purchase Details
Closed on
Feb 21, 2012
Sold by
Brown Masha
Bought by
Brown Christian
Purchase Details
Closed on
Feb 19, 2012
Sold by
Urquhart Brown Susan
Bought by
Brown Christopher
Purchase Details
Closed on
Dec 12, 2011
Sold by
Flavel Patricia J
Bought by
Marshall Penny V and The Flavel Irrevocable Trust
Create a Home Valuation Report for This Property
The Home Valuation Report is an in-depth analysis detailing your home's value as well as a comparison with similar homes in the area
Home Values in the Area
Average Home Value in this Area
Purchase History
| Date | Buyer | Sale Price | Title Company |
|---|---|---|---|
| Williams Gary S | $760,000 | Old Republic Title Company | |
| Brown Christian | -- | Old Republic Title Company | |
| Brown Christopher | $273,000 | Old Republic Title Company | |
| Brown Christopher | -- | Old Republic Title Company | |
| Marshall Penny V | -- | Old Republic Title Company |
Source: Public Records
Mortgage History
| Date | Status | Borrower | Loan Amount |
|---|---|---|---|
| Open | Williams Gary S | $608,000 |
Source: Public Records
Tax History
| Year | Tax Paid | Tax Assessment Tax Assessment Total Assessment is a certain percentage of the fair market value that is determined by local assessors to be the total taxable value of land and additions on the property. | Land | Improvement |
|---|---|---|---|---|
| 2025 | $13,529 | $928,848 | $280,754 | $655,094 |
| 2024 | $13,529 | $910,501 | $275,250 | $642,251 |
| 2023 | $14,121 | $899,512 | $269,853 | $629,659 |
| 2022 | $13,909 | $874,880 | $264,564 | $617,316 |
| 2021 | $13,268 | $857,590 | $259,377 | $605,213 |
| 2020 | $13,122 | $855,728 | $256,718 | $599,010 |
| 2019 | $12,684 | $838,955 | $251,686 | $587,269 |
| 2018 | $12,415 | $822,510 | $246,753 | $575,757 |
| 2017 | $11,960 | $806,381 | $241,914 | $564,467 |
| 2016 | $11,618 | $790,574 | $237,172 | $553,402 |
| 2015 | $11,723 | $778,703 | $233,611 | $545,092 |
| 2014 | $11,887 | $763,450 | $229,035 | $534,415 |
Source: Public Records
Map
Nearby Homes
- 1515 Hampel St
- 1424 Hampel St
- 4033 Park Blvd
- 3927 Canon Ave
- 1235 Hampel St
- 1233 Hampel St
- 3525 Dimond Ave
- 4426 Park Blvd
- 1331 Excelsior Ave
- 3081 23rd Ave
- 1458 E 33rd St
- 1420 E 33rd St
- 2550 Pleasant St
- 1374 El Centro Ave
- 3123 Beaumont Ave
- 2257 Macarthur Blvd
- 3464 Champion St
- 2050 E 30th St
- 3006 14th Ave
- 741 Grosvenor Place
- 1624 E 38th St
- 3825 Woodruff Ave
- 1612 E 38th St
- 3763 Woodruff Ave
- 3800 Woodruff Ave
- 3810 Woodruff Ave
- 3760 Ardley Ave
- 3829 Woodruff Ave
- 3810 Ardley Ave
- 3818 Woodruff Ave
- 3759 Woodruff Ave
- 3816 Ardley Ave
- 3754 Ardley Ave
- 3824 Woodruff Ave
- 3800 Ardley Ave
- 3820 Ardley Ave
- 3837 Woodruff Ave
- 3753 Woodruff Ave
- 3748 Ardley Ave
- 3828 Woodruff Ave
Your Personal Tour Guide
Ask me questions while you tour the home.