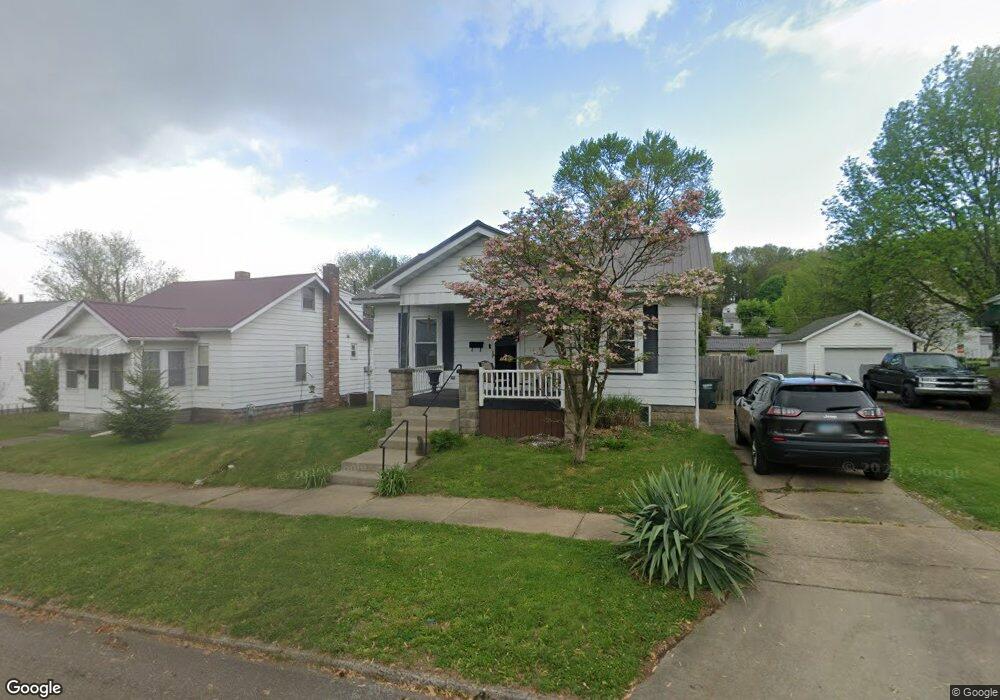
1632 Walnut St Coshocton, OH 43812
Estimated Value: $126,142 - $146,000
2
Beds
1
Bath
794
Sq Ft
$173/Sq Ft
Est. Value
About This Home
This home is located at 1632 Walnut St, Coshocton, OH 43812 and is currently estimated at $137,286, approximately $172 per square foot. 1632 Walnut St is a home located in Coshocton County with nearby schools including Coshocton High School, Coshocton Opportunity School, and Sacred Heart Elementary School.
Ownership History
Date
Name
Owned For
Owner Type
Purchase Details
Closed on
Apr 14, 2008
Sold by
Brown Kirsten S and Mcpeck Kirsten S
Bought by
Smith Stephanie Y
Current Estimated Value
Home Financials for this Owner
Home Financials are based on the most recent Mortgage that was taken out on this home.
Original Mortgage
$69,500
Outstanding Balance
$44,287
Interest Rate
6.17%
Mortgage Type
New Conventional
Estimated Equity
$92,999
Purchase Details
Closed on
Apr 10, 2002
Sold by
Hoffman Ritchie Ann
Bought by
Brown Kirsten S
Purchase Details
Closed on
Nov 1, 1996
Sold by
Richard Kathryn E
Bought by
Hoffman Ritchie Ann
Create a Home Valuation Report for This Property
The Home Valuation Report is an in-depth analysis detailing your home's value as well as a comparison with similar homes in the area
Home Values in the Area
Average Home Value in this Area
Purchase History
| Date | Buyer | Sale Price | Title Company |
|---|---|---|---|
| Smith Stephanie Y | $65,000 | None Available | |
| Brown Kirsten S | $58,000 | -- | |
| Hoffman Ritchie Ann | $42,000 | -- |
Source: Public Records
Mortgage History
| Date | Status | Borrower | Loan Amount |
|---|---|---|---|
| Open | Smith Stephanie Y | $69,500 |
Source: Public Records
Tax History Compared to Growth
Tax History
| Year | Tax Paid | Tax Assessment Tax Assessment Total Assessment is a certain percentage of the fair market value that is determined by local assessors to be the total taxable value of land and additions on the property. | Land | Improvement |
|---|---|---|---|---|
| 2024 | $1,010 | $24,420 | $4,850 | $19,570 |
| 2023 | $1,010 | $20,412 | $3,395 | $17,017 |
| 2022 | $976 | $20,412 | $3,395 | $17,017 |
| 2021 | $965 | $20,143 | $3,395 | $16,748 |
| 2020 | $881 | $17,805 | $3,469 | $14,336 |
| 2019 | $891 | $17,805 | $3,469 | $14,336 |
| 2018 | $853 | $17,805 | $3,469 | $14,336 |
| 2017 | $843 | $16,374 | $3,238 | $13,136 |
| 2016 | $808 | $16,374 | $3,238 | $13,136 |
| 2015 | $406 | $16,374 | $3,238 | $13,136 |
| 2014 | $756 | $16,405 | $3,238 | $13,167 |
Source: Public Records
Map
Nearby Homes