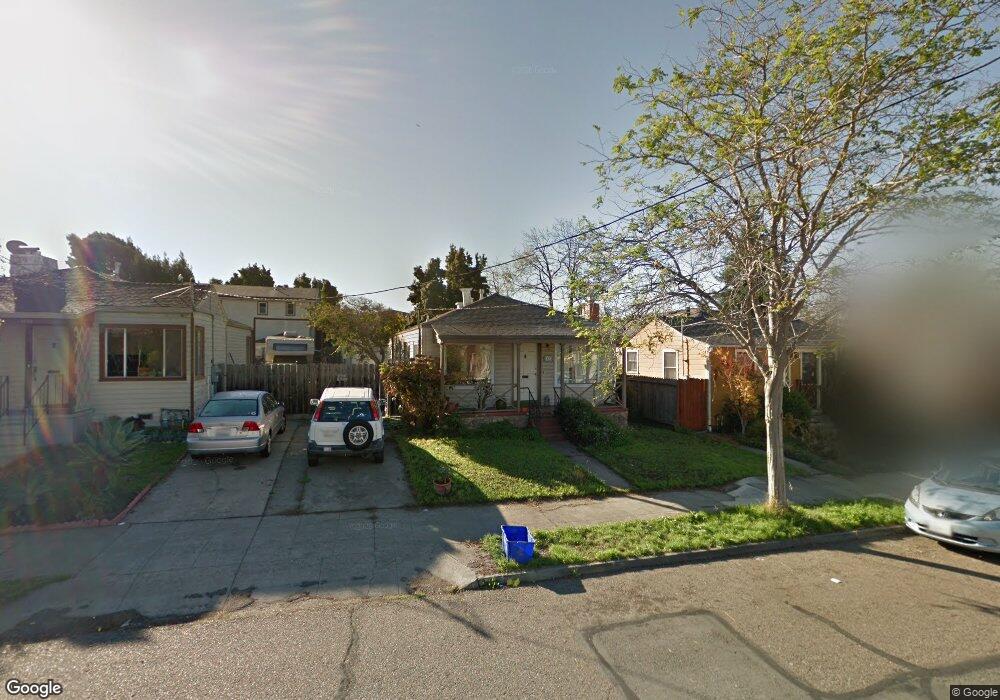
1632 Ward St Berkeley, CA 94703
South Berkeley NeighborhoodEstimated Value: $860,000 - $1,308,000
3
Beds
1
Bath
1,012
Sq Ft
$1,070/Sq Ft
Est. Value
About This Home
This home is located at 1632 Ward St, Berkeley, CA 94703 and is currently estimated at $1,082,815, approximately $1,069 per square foot. 1632 Ward St is a home located in Alameda County with nearby schools including Malcolm X Elementary School, Washington Elementary School, and Oxford Elementary School.
Ownership History
Date
Name
Owned For
Owner Type
Purchase Details
Closed on
Jul 9, 2002
Sold by
Kretz Linda L and Cruikshank Percy
Bought by
Montauk Lance
Current Estimated Value
Purchase Details
Closed on
Sep 25, 2001
Sold by
Cruikshank Robert L
Bought by
Cruikshank Percy
Purchase Details
Closed on
Feb 6, 2001
Sold by
Montauk Krystyna
Bought by
Montauk Lance
Home Financials for this Owner
Home Financials are based on the most recent Mortgage that was taken out on this home.
Original Mortgage
$95,000
Interest Rate
7.08%
Create a Home Valuation Report for This Property
The Home Valuation Report is an in-depth analysis detailing your home's value as well as a comparison with similar homes in the area
Home Values in the Area
Average Home Value in this Area
Purchase History
| Date | Buyer | Sale Price | Title Company |
|---|---|---|---|
| Montauk Lance | $385,000 | First American Title Guarant | |
| Cruikshank Percy | -- | -- | |
| Montauk Lance | -- | Financial Title Company |
Source: Public Records
Mortgage History
| Date | Status | Borrower | Loan Amount |
|---|---|---|---|
| Previous Owner | Montauk Lance | $95,000 |
Source: Public Records
Tax History
| Year | Tax Paid | Tax Assessment Tax Assessment Total Assessment is a certain percentage of the fair market value that is determined by local assessors to be the total taxable value of land and additions on the property. | Land | Improvement |
|---|---|---|---|---|
| 2025 | $8,680 | $557,556 | $167,267 | $390,289 |
| 2024 | $8,680 | $546,626 | $163,988 | $382,638 |
| 2023 | $8,495 | $535,911 | $160,773 | $375,138 |
| 2022 | $8,341 | $525,404 | $157,621 | $367,783 |
| 2021 | $8,356 | $515,106 | $154,532 | $360,574 |
| 2020 | $7,926 | $509,827 | $152,948 | $356,879 |
| 2019 | $7,631 | $499,833 | $149,950 | $349,883 |
| 2018 | $7,501 | $490,034 | $147,010 | $343,024 |
| 2017 | $7,222 | $480,428 | $144,128 | $336,300 |
| 2016 | $6,997 | $471,011 | $141,303 | $329,708 |
| 2015 | $6,905 | $463,940 | $139,182 | $324,758 |
| 2014 | $6,811 | $454,854 | $136,456 | $318,398 |
Source: Public Records
Map
Nearby Homes
- 2829 California St
- 1612 Carleton St
- 2701 Grant St
- 1612 Parker St
- 1515 Derby St
- 2750 Sacramento St
- 2758 Sacramento St
- 2774 Sacramento St
- 2782 Sacramento St
- 2790 Sacramento St
- 1450 Ward St
- 1634 Blake St
- 1535 Julia St
- 2926 Ellis St
- 1646 Ashby Ave
- 1604 Dwight Way
- 1645 Dwight Way
- 1901 Parker St Unit 3
- 2922 Stanton St
- 3033 Ellis St Unit B
Your Personal Tour Guide
Ask me questions while you tour the home.