Estimated Value: $293,001 - $325,000
2
Beds
2
Baths
1,600
Sq Ft
$195/Sq Ft
Est. Value
About This Home
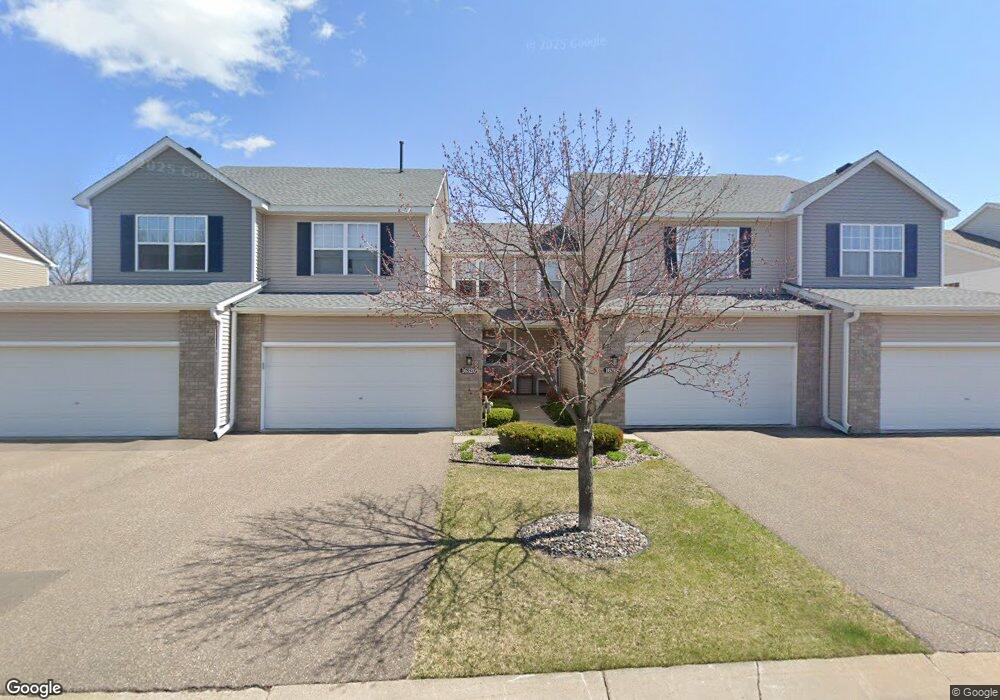
This home is located at 16320 70th Ave N, Osseo, MN 55311 and is currently estimated at $312,500, approximately $195 per square foot. 16320 70th Ave N is a home located in Hennepin County with nearby schools including Basswood Elementary School, Maple Grove Middle School, and Maple Grove Senior High School.
Ownership History
Date
Name
Owned For
Owner Type
Purchase Details
Closed on
Jun 21, 2021
Sold by
Jung Amanda
Bought by
Sliger Kim
Current Estimated Value
Home Financials for this Owner
Home Financials are based on the most recent Mortgage that was taken out on this home.
Original Mortgage
$264,500
Outstanding Balance
$239,472
Interest Rate
2.9%
Mortgage Type
Stand Alone Second
Estimated Equity
$73,028
Purchase Details
Closed on
Mar 26, 2019
Sold by
Champ Katherine M and Champ Jon
Bought by
Jung Amanda
Home Financials for this Owner
Home Financials are based on the most recent Mortgage that was taken out on this home.
Original Mortgage
$190,000
Interest Rate
4.3%
Mortgage Type
New Conventional
Purchase Details
Closed on
Jul 21, 2006
Sold by
Geurkink Isabelle
Bought by
Rouse Katherine M
Purchase Details
Closed on
Jul 25, 2002
Sold by
Centex Homes Minnesota Division
Bought by
Geurkink Christopher and Geurkink Isabelle
Create a Home Valuation Report for This Property
The Home Valuation Report is an in-depth analysis detailing your home's value as well as a comparison with similar homes in the area
Home Values in the Area
Average Home Value in this Area
Purchase History
| Date | Buyer | Sale Price | Title Company |
|---|---|---|---|
| Sliger Kim | $279,900 | Titlesmart Inc | |
| Jung Amanda | $220,000 | Edina Realty Title Inc | |
| Rouse Katherine M | $212,500 | -- | |
| Geurkink Christopher | $188,130 | -- |
Source: Public Records
Mortgage History
| Date | Status | Borrower | Loan Amount |
|---|---|---|---|
| Open | Sliger Kim | $264,500 | |
| Closed | Sliger Kim | $264,500 | |
| Previous Owner | Jung Amanda | $190,000 |
Source: Public Records
Tax History Compared to Growth
Tax History
| Year | Tax Paid | Tax Assessment Tax Assessment Total Assessment is a certain percentage of the fair market value that is determined by local assessors to be the total taxable value of land and additions on the property. | Land | Improvement |
|---|---|---|---|---|
| 2024 | $2,991 | $264,200 | $52,100 | $212,100 |
| 2023 | $2,713 | $243,300 | $31,800 | $211,500 |
| 2022 | $2,889 | $263,200 | $40,200 | $223,000 |
| 2021 | $2,635 | $250,100 | $56,900 | $193,200 |
| 2020 | $2,514 | $227,100 | $40,800 | $186,300 |
| 2019 | $2,746 | $208,300 | $35,600 | $172,700 |
| 2018 | $2,677 | $199,400 | $39,800 | $159,600 |
| 2017 | $2,613 | $178,400 | $45,000 | $133,400 |
| 2016 | $2,448 | $164,800 | $37,000 | $127,800 |
| 2015 | $2,431 | $159,200 | $40,000 | $119,200 |
| 2014 | -- | $136,800 | $31,000 | $105,800 |
Source: Public Records
Map
Nearby Homes
- 16314 70th Ave N
- 6979 Weston Ln N
- 7099 Weston Ln N
- 7087 Weston Ln N
- 7082 Weston Ln N
- 7094 Weston Ln N
- 16586 73rd Ave N
- 7225 Everest Ln N
- 17095 72nd Ave N Unit 4301
- 15653 73rd Cir N
- 15770 73rd Place N
- 16917 73rd Place N
- 7247 Quantico Ln N
- 7201 Jewel Ln N Unit 907
- 7244 Quantico Ln N
- 7569 Blackoaks Ln N
- 17248 72nd Ave N Unit 1405
- 7460 Shenandoah Ln N
- 7585 Blackoaks Ln N
- 17344 72nd Ave N Unit 1304
- 16324 16324 70th-Avenue-n
- 16324 16324 70th Ave N
- 16318 70th Ave N
- 16324 70th Ave N Unit 504
- 16318 70th Ave N
- 16300 70th Ave N
- 16304 70th Ave N
- 16300 70th Ave N
- 16300 70th Ave N
- 16302 70th Ave N
- 16302 70th Ave N Unit 503
- 16308 70th Ave N
- 16330 70th Ave N
- 16334 70th Ave N
- 16340 70th Ave N Unit 701
- 16334 70th Ave N
- 16326 70th Ave N Unit 303
- 16310 70th Ave N Unit 504
- 16312 70th Ave N Unit 402
- 16316 70th Ave N