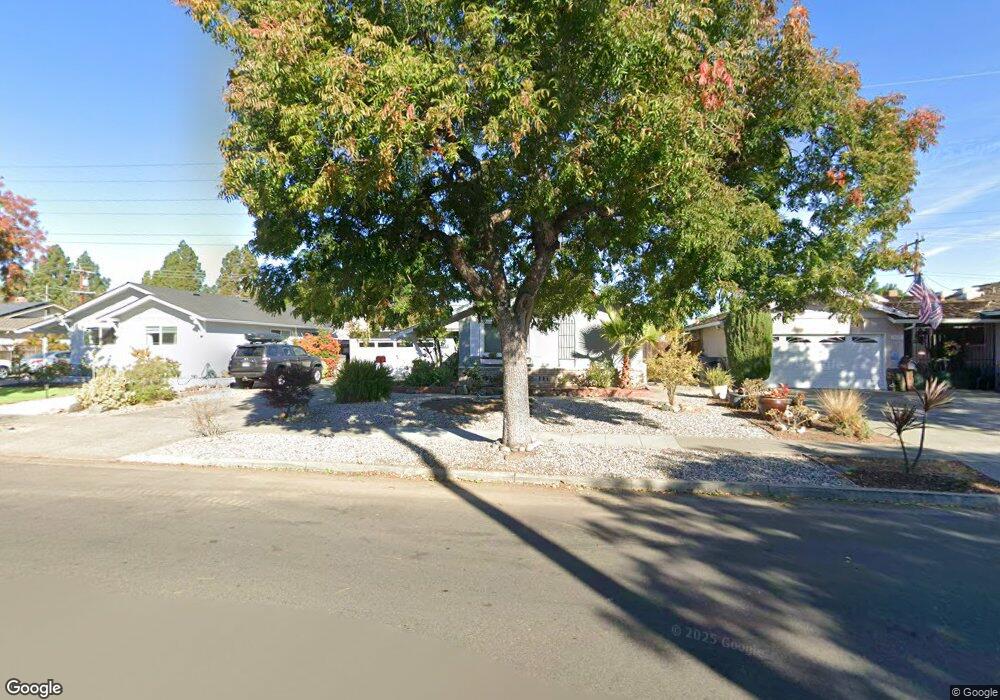
1633 Clovis Ave San Jose, CA 95124
De Voss-Leigh NeighborhoodEstimated Value: $1,623,094 - $1,733,000
3
Beds
2
Baths
1,220
Sq Ft
$1,389/Sq Ft
Est. Value
About This Home
This home is located at 1633 Clovis Ave, San Jose, CA 95124 and is currently estimated at $1,695,024, approximately $1,389 per square foot. 1633 Clovis Ave is a home located in Santa Clara County with nearby schools including Noddin Elementary School, Lietz Elementary School, and Union Middle School.
Ownership History
Date
Name
Owned For
Owner Type
Purchase Details
Closed on
Apr 6, 2021
Sold by
Katrib Suhail
Bought by
Katrib Suhail and Suhail Katrib Revocable Trust
Current Estimated Value
Purchase Details
Closed on
Mar 30, 1999
Sold by
Katrib Renee
Bought by
Katrib Suhail
Home Financials for this Owner
Home Financials are based on the most recent Mortgage that was taken out on this home.
Original Mortgage
$224,000
Outstanding Balance
$53,981
Interest Rate
6.7%
Estimated Equity
$1,641,043
Purchase Details
Closed on
Mar 9, 1999
Sold by
Leitner Shari J
Bought by
Katrib Suhail and Katrib Renee
Home Financials for this Owner
Home Financials are based on the most recent Mortgage that was taken out on this home.
Original Mortgage
$224,000
Outstanding Balance
$53,981
Interest Rate
6.7%
Estimated Equity
$1,641,043
Create a Home Valuation Report for This Property
The Home Valuation Report is an in-depth analysis detailing your home's value as well as a comparison with similar homes in the area
Home Values in the Area
Average Home Value in this Area
Purchase History
| Date | Buyer | Sale Price | Title Company |
|---|---|---|---|
| Katrib Suhail | -- | None Available | |
| Katrib Suhail | -- | -- | |
| Katrib Suhail | $280,000 | First American Title Guarant |
Source: Public Records
Mortgage History
| Date | Status | Borrower | Loan Amount |
|---|---|---|---|
| Open | Katrib Suhail | $224,000 |
Source: Public Records
Tax History
| Year | Tax Paid | Tax Assessment Tax Assessment Total Assessment is a certain percentage of the fair market value that is determined by local assessors to be the total taxable value of land and additions on the property. | Land | Improvement |
|---|---|---|---|---|
| 2025 | $7,087 | $438,936 | $297,854 | $141,082 |
| 2024 | $7,087 | $430,330 | $292,014 | $138,316 |
| 2023 | $6,919 | $421,893 | $286,289 | $135,604 |
| 2022 | $6,789 | $413,622 | $280,676 | $132,946 |
| 2021 | $6,622 | $405,513 | $275,173 | $130,340 |
| 2020 | $6,455 | $401,356 | $272,352 | $129,004 |
| 2019 | $6,326 | $393,487 | $267,012 | $126,475 |
| 2018 | $6,167 | $385,773 | $261,777 | $123,996 |
| 2017 | $6,082 | $378,210 | $256,645 | $121,565 |
| 2016 | $5,801 | $370,795 | $251,613 | $119,182 |
| 2015 | $5,706 | $365,226 | $247,834 | $117,392 |
| 2014 | $5,214 | $358,073 | $242,980 | $115,093 |
Source: Public Records
Map
Nearby Homes
- 5451 Lauren Dr
- 1666 Blossom Hill Rd
- 1705 Blossom Hill Rd
- 1711 Blossom Hill Rd
- 1554 Calinoma Dr
- 0000 Harwood Rd
- 114 Gemini Ct
- 1532 Kooser Rd
- 1685 Zinnia Ln
- 5524 Harvard Dr
- 1769 Gilda Way
- 4999 Gattucio Dr
- 5072 Hawley Ct
- 5805 Chambertin Dr
- 1516 Ivan Place
- 1571 Rebel Way
- 4849 Pine Forest Place
- 5351 Calderwood Ln
- 1441 Dentwood Dr
- 4822 Pepperwood Way
- 1639 Clovis Ave
- 1627 Clovis Ave
- 1643 Clovis Ave
- 1623 Clovis Ave
- 5454 Rudy Dr
- 5451 Amby Dr
- 1647 Clovis Ave
- 1619 Clovis Ave
- 5466 Rudy Dr
- 5459 Amby Dr
- 5453 Rudy Dr
- 1651 Clovis Ave
- 1615 Clovis Ave
- 0 Camden Ave Unit ML81326739
- 0 Camden Ave Unit ML81459975
- 0 Camden Ave Unit ML81643046
- 5465 Rudy Dr
- 5478 Rudy Dr
- 5469 Amby Dr
- 5415 Camden Ave
Your Personal Tour Guide
Ask me questions while you tour the home.