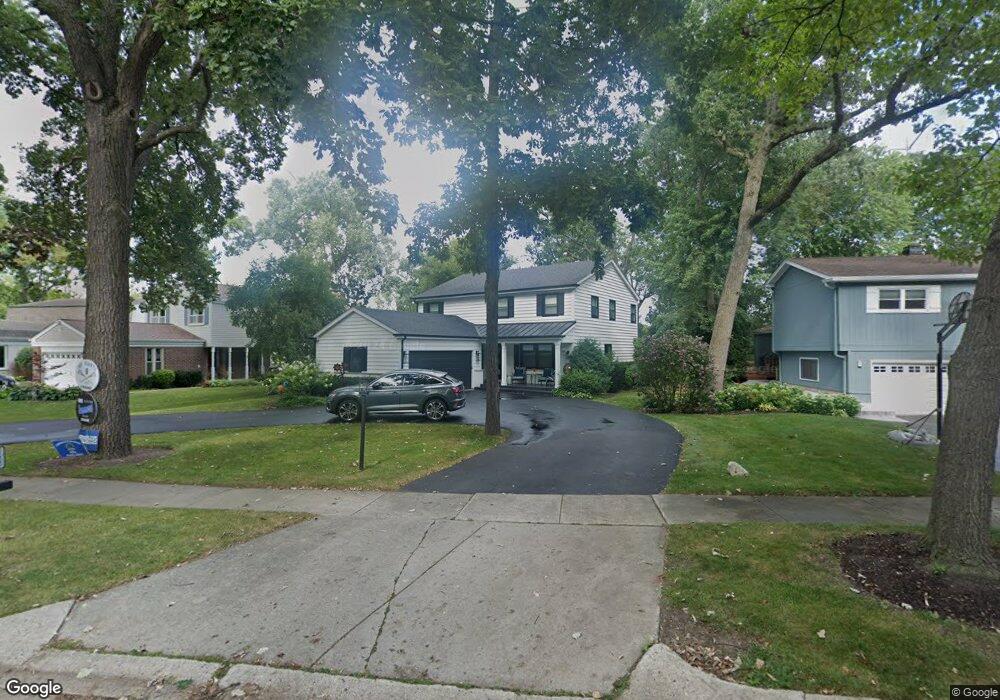
1633 Mccraren Rd Highland Park, IL 60035
West Highland Park NeighborhoodEstimated Value: $714,000 - $866,767
--
Bed
3
Baths
2,368
Sq Ft
$349/Sq Ft
Est. Value
About This Home
This home is located at 1633 Mccraren Rd, Highland Park, IL 60035 and is currently estimated at $825,442, approximately $348 per square foot. 1633 Mccraren Rd is a home located in Lake County with nearby schools including Sherwood Elementary School, Edgewood Middle School, and Highland Park High School.
Ownership History
Date
Name
Owned For
Owner Type
Purchase Details
Closed on
Aug 19, 2025
Sold by
Jodi Crane Revocable Trust and Crane Jodi
Bought by
Cohen Jared and Cohen Kacie
Current Estimated Value
Home Financials for this Owner
Home Financials are based on the most recent Mortgage that was taken out on this home.
Original Mortgage
$783,200
Outstanding Balance
$781,794
Interest Rate
6.55%
Mortgage Type
New Conventional
Estimated Equity
$43,648
Purchase Details
Closed on
Jul 13, 2022
Sold by
Sean Freeman
Bought by
Jodi Crane Revocable Trust
Home Financials for this Owner
Home Financials are based on the most recent Mortgage that was taken out on this home.
Original Mortgage
$534,590
Interest Rate
5%
Mortgage Type
New Conventional
Purchase Details
Closed on
Dec 9, 2021
Sold by
Sandi Kaplan Declaration Of Trust
Bought by
Freeman Sean
Home Financials for this Owner
Home Financials are based on the most recent Mortgage that was taken out on this home.
Original Mortgage
$378,000
Interest Rate
3.92%
Mortgage Type
Construction
Purchase Details
Closed on
Apr 18, 2002
Sold by
Kaplan Sandi Adler
Bought by
Kaplan Sandi and Sandi Kaplan Declaration Of Tr
Create a Home Valuation Report for This Property
The Home Valuation Report is an in-depth analysis detailing your home's value as well as a comparison with similar homes in the area
Home Values in the Area
Average Home Value in this Area
Purchase History
| Date | Buyer | Sale Price | Title Company |
|---|---|---|---|
| Cohen Jared | $979,000 | Chicago Title | |
| Jodi Crane Revocable Trust | $764,000 | Chicago Title | |
| Freeman Sean | $300,000 | Proper Title | |
| Kaplan Sandi | -- | -- |
Source: Public Records
Mortgage History
| Date | Status | Borrower | Loan Amount |
|---|---|---|---|
| Open | Cohen Jared | $783,200 | |
| Previous Owner | Jodi Crane Revocable Trust | $534,590 | |
| Previous Owner | Freeman Sean | $378,000 |
Source: Public Records
Tax History Compared to Growth
Tax History
| Year | Tax Paid | Tax Assessment Tax Assessment Total Assessment is a certain percentage of the fair market value that is determined by local assessors to be the total taxable value of land and additions on the property. | Land | Improvement |
|---|---|---|---|---|
| 2024 | $12,694 | $169,276 | $49,374 | $119,902 |
| 2023 | $13,132 | $152,583 | $44,505 | $108,078 |
| 2022 | $13,132 | $151,711 | $48,890 | $102,821 |
| 2021 | $11,675 | $146,652 | $47,260 | $99,392 |
| 2020 | $11,293 | $146,652 | $47,260 | $99,392 |
| 2019 | $11,319 | $150,934 | $47,039 | $103,895 |
| 2018 | $9,703 | $135,758 | $40,688 | $95,070 |
| 2017 | $9,741 | $134,975 | $40,453 | $94,522 |
| 2016 | $9,381 | $128,499 | $38,512 | $89,987 |
| 2015 | $9,066 | $119,390 | $35,782 | $83,608 |
| 2014 | $8,960 | $115,395 | $33,590 | $81,805 |
| 2012 | $9,516 | $121,219 | $33,786 | $87,433 |
Source: Public Records
Map
Nearby Homes
- 1653 Mccraren Rd
- 1552 Mccraren Rd
- 1672 Huntington Ln
- 1250 Park Ave W Unit 435
- 1666 Cloverdale Ave
- 1220 Park Ave W Unit 115
- 1753 Elmwood Dr
- 2013 Castlewood Rd
- 1341 Carlisle Place
- 1263 Carlisle Place
- 1075 Heather Rd
- 1020 Deerfield Rd Unit 1020
- 1773 Winthrop Rd
- 1039 Deerfield Place Unit 1039
- 1572 Mcdaniels Ave
- 2230 Shady Ln
- 940 Augusta Way Unit 309
- 940 Augusta Way Unit 304
- 2325 Shady Ln
- 861 Laurel Ave Unit 3
- 1625 Mccraren Rd
- 1641 Mccraren Rd
- 1617 Mccraren Rd
- 1647 Mccraren Rd
- 1609 Mccraren Rd
- 1543 Berkeley Rd
- 1563 Berkeley Rd
- 1618 Mccraren Rd
- 1630 Mccraren Rd
- 1657 Mccraren Rd
- 1642 Mccraren Rd
- 1663 Mccraren Rd
- 1652 Mccraren Rd
- 1560 Berkeley Rd
- 1671 Mccraren Rd
- 1662 Mccraren Rd
- 1609 Arbor Ave
- 1566 Robin Hood Place
- 1578 Mccraren Rd
- 1580 Berkeley Rd