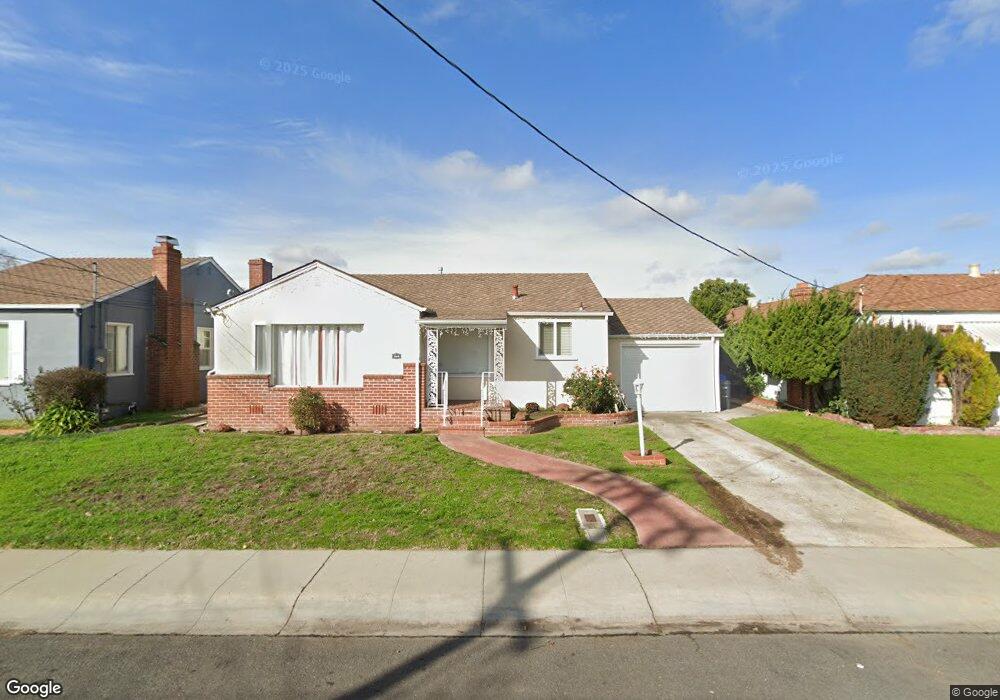
1633 Russ Ave San Leandro, CA 94578
Upper Bal NeighborhoodEstimated Value: $636,000 - $796,000
2
Beds
1
Bath
1,018
Sq Ft
$723/Sq Ft
Est. Value
About This Home
This home is located at 1633 Russ Ave, San Leandro, CA 94578 and is currently estimated at $735,841, approximately $722 per square foot. 1633 Russ Ave is a home located in Alameda County with nearby schools including Jefferson Elementary School, Bancroft Middle School, and San Leandro High School.
Ownership History
Date
Name
Owned For
Owner Type
Purchase Details
Closed on
Jun 29, 2015
Sold by
Armsted Lattice and Banks Lattice Y
Bought by
Chen Li and Liang Jie Ning
Current Estimated Value
Home Financials for this Owner
Home Financials are based on the most recent Mortgage that was taken out on this home.
Original Mortgage
$282,000
Outstanding Balance
$230,818
Interest Rate
5.37%
Mortgage Type
Adjustable Rate Mortgage/ARM
Estimated Equity
$505,023
Purchase Details
Closed on
Mar 19, 2009
Sold by
Cahall Jack E and The Jack E Cahll Living Trust
Bought by
Banks Lattice Y
Home Financials for this Owner
Home Financials are based on the most recent Mortgage that was taken out on this home.
Original Mortgage
$319,113
Interest Rate
5.19%
Mortgage Type
FHA
Purchase Details
Closed on
Jun 8, 2007
Sold by
Cahall Jack E
Bought by
Cahall Jack E and Jack E Cahall Living Trust
Purchase Details
Closed on
Jan 12, 2007
Sold by
Cahall Ricky G and Irene G Cahall Living Trust
Bought by
Cahall Jack E
Purchase Details
Closed on
Mar 17, 1999
Sold by
Matthews Florence
Bought by
Matthews Myron L and Matthews Florence S
Purchase Details
Closed on
Feb 22, 1994
Sold by
Cahall Irene G
Bought by
Cahall Irene G
Create a Home Valuation Report for This Property
The Home Valuation Report is an in-depth analysis detailing your home's value as well as a comparison with similar homes in the area
Home Values in the Area
Average Home Value in this Area
Purchase History
We collect this data history from publicly available records. To have your information removed, we recommend requesting removal directly through your county’s website.
| Date | Buyer | Sale Price | Title Company |
|---|---|---|---|
| Chen Li | $470,000 | Chicago Title Company | |
| Banks Lattice Y | $325,000 | Fidelity National Title Co | |
| Cahall Jack E | -- | None Available | |
| Cahall Jack E | -- | None Available | |
| Matthews Myron L | -- | -- | |
| Cahall Irene G | -- | -- |
Source: Public Records
Mortgage History
We collect this data history from publicly available records. To have your information removed, we recommend requesting removal directly through your county’s website.
| Date | Status | Borrower | Loan Amount |
|---|---|---|---|
| Open | Chen Li | $282,000 | |
| Previous Owner | Banks Lattice Y | $319,113 |
Source: Public Records
Tax History
| Year | Tax Paid | Tax Assessment Tax Assessment Total Assessment is a certain percentage of the fair market value that is determined by local assessors to be the total taxable value of land and additions on the property. | Land | Improvement |
|---|---|---|---|---|
| 2025 | $7,375 | $556,371 | $166,911 | $389,460 |
| 2024 | $7,375 | $545,462 | $163,638 | $381,824 |
| 2023 | $7,398 | $534,770 | $160,431 | $374,339 |
| 2022 | $7,174 | $524,284 | $157,285 | $366,999 |
| 2021 | $6,970 | $514,005 | $154,201 | $359,804 |
| 2020 | $6,800 | $508,737 | $152,621 | $356,116 |
| 2019 | $6,586 | $498,763 | $149,629 | $349,134 |
| 2018 | $6,400 | $488,987 | $146,696 | $342,291 |
| 2017 | $6,276 | $479,400 | $143,820 | $335,580 |
| 2016 | $5,936 | $470,000 | $141,000 | $329,000 |
| 2015 | $4,505 | $348,224 | $104,467 | $243,757 |
| 2014 | $4,674 | $341,405 | $102,421 | $238,984 |
Source: Public Records
Map
Nearby Homes
- 14564 Wake Ave
- 13904 Lark St
- 14590 Bancroft Ave
- 2724 Benedict Dr
- 13955 School St
- 1336 139th Ave
- 0 Saturn Dr
- 14831 Bancroft Ave Unit Space 27
- 14621 Pansy St
- 1522 Dennis Ave
- 0 Montrose Dr
- 2082 Placer Dr
- 1268 136th Ave
- 1315 135th Ave
- 1233 Benedict Ct
- 1902 Evergreen Ave
- 2245 Sol St
- 575 Mckinley Ct
- 1961 Marineview Dr
- 2399 E 14th St Unit 60
Your Personal Tour Guide
Ask me questions while you tour the home.