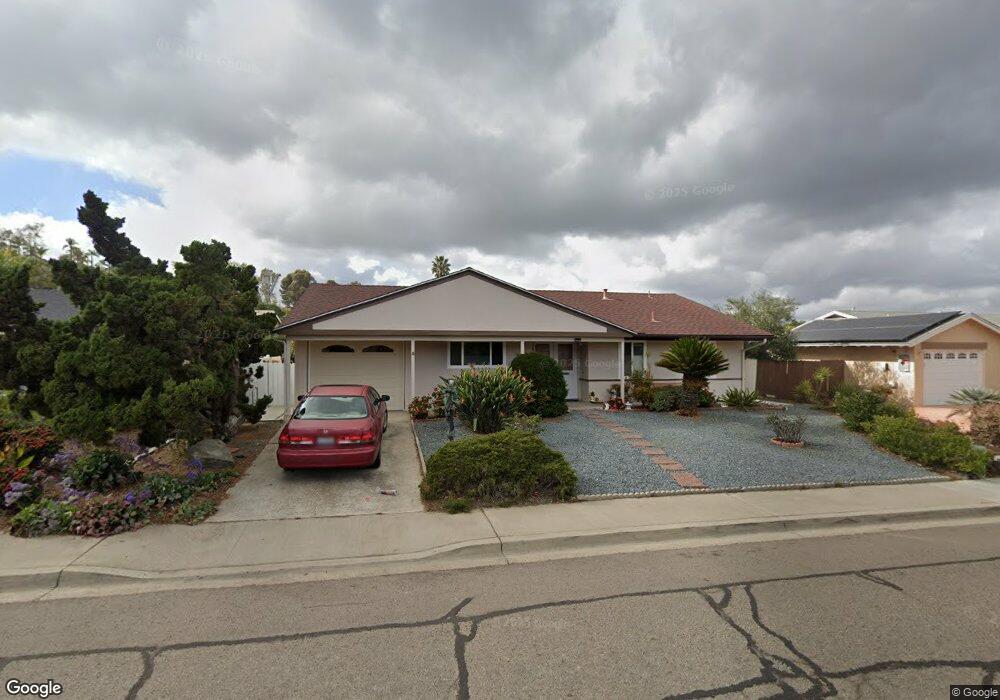
16334 Felice Dr San Diego, CA 92128
Rancho Bernardo NeighborhoodEstimated Value: $779,000 - $881,000
2
Beds
2
Baths
1,197
Sq Ft
$699/Sq Ft
Est. Value
About This Home
This home is located at 16334 Felice Dr, San Diego, CA 92128 and is currently estimated at $836,596, approximately $698 per square foot. 16334 Felice Dr is a home located in San Diego County with nearby schools including Highland Ranch Elementary School, Bernardo Heights Middle, and Rancho Bernardo High.
Ownership History
Date
Name
Owned For
Owner Type
Purchase Details
Closed on
Sep 22, 2017
Sold by
Kha Tiffany
Bought by
Kha Tiffany and Tiffany Kha Family Trust
Current Estimated Value
Purchase Details
Closed on
Dec 1, 2006
Sold by
Harris Terry Lee
Bought by
Kha Tiffany
Home Financials for this Owner
Home Financials are based on the most recent Mortgage that was taken out on this home.
Original Mortgage
$273,000
Outstanding Balance
$161,860
Interest Rate
6.16%
Mortgage Type
New Conventional
Estimated Equity
$674,736
Purchase Details
Closed on
Mar 16, 1996
Sold by
Harris Harlan Herbert and Harris Margaret Elizabeth
Bought by
Harris Harlan Herbert and Harris Margaret Elizabeth
Purchase Details
Closed on
Dec 27, 1993
Sold by
Barnard Gail L
Bought by
Harris Harlan H and Harris Margaret E
Home Financials for this Owner
Home Financials are based on the most recent Mortgage that was taken out on this home.
Original Mortgage
$50,000
Interest Rate
7.19%
Purchase Details
Closed on
Sep 24, 1985
Create a Home Valuation Report for This Property
The Home Valuation Report is an in-depth analysis detailing your home's value as well as a comparison with similar homes in the area
Home Values in the Area
Average Home Value in this Area
Purchase History
| Date | Buyer | Sale Price | Title Company |
|---|---|---|---|
| Kha Tiffany | -- | None Available | |
| Kha Tiffany | $341,500 | Commonwealth Land Title Co | |
| Harris Harlan Herbert | -- | -- | |
| Harris Harlan H | $113,000 | Fidelity National Title | |
| -- | $94,000 | -- |
Source: Public Records
Mortgage History
| Date | Status | Borrower | Loan Amount |
|---|---|---|---|
| Open | Kha Tiffany | $273,000 | |
| Previous Owner | Harris Harlan H | $50,000 |
Source: Public Records
Tax History Compared to Growth
Tax History
| Year | Tax Paid | Tax Assessment Tax Assessment Total Assessment is a certain percentage of the fair market value that is determined by local assessors to be the total taxable value of land and additions on the property. | Land | Improvement |
|---|---|---|---|---|
| 2025 | $5,023 | $457,177 | $361,727 | $95,450 |
| 2024 | $5,023 | $448,214 | $354,635 | $93,579 |
| 2023 | $4,915 | $439,427 | $347,682 | $91,745 |
| 2022 | $4,832 | $430,812 | $340,865 | $89,947 |
| 2021 | $4,768 | $422,366 | $334,182 | $88,184 |
| 2020 | $4,703 | $418,036 | $330,756 | $87,280 |
| 2019 | $4,580 | $409,840 | $324,271 | $85,569 |
| 2018 | $4,450 | $401,805 | $317,913 | $83,892 |
| 2017 | $83 | $393,928 | $311,680 | $82,248 |
| 2016 | $4,240 | $386,205 | $305,569 | $80,636 |
| 2015 | $3,951 | $360,000 | $283,000 | $77,000 |
| 2014 | $3,825 | $350,000 | $276,000 | $74,000 |
Source: Public Records
Map
Nearby Homes
- 12365 Horado Rd
- 12494 Senda Rd
- 12486 Lomica Dr
- 12249 Horado Rd
- 16515 Felice Dr
- 16422 Roca Dr
- 16421 Ramada Dr
- 16498 Roca Dr
- 12257 Avenida Consentido
- 16413 Roca Dr
- 16182 Selva Dr
- 12424 Rios Rd
- 12195 San Tomas Place
- 16632 Roca Dr Unit 41
- 16556 Gabarda Rd
- 16660 Roca Dr
- 15945 Avenida Villaha Unit 32
- 16407 Caminito Vecinos Unit 155
- 12753 Caminito Cancion Unit 129
- 12206 Fairway Pointe Row
- 16350 Felice Dr
- 16318 Felice Dr Unit 7
- 16343 Bernardo Oaks Dr
- 16357 Bernardo Oaks Dr
- 16329 Bernardo Oaks Dr
- 16366 Felice Dr
- 12340 Mantilla Rd
- 12323 Mantilla Rd
- 16315 Bernardo Oaks Dr
- 16371 Bernardo Oaks Dr
- 12333 Mantilla Rd
- 16384 Felice Dr
- 12350 Mantilla Rd
- 16369 Felice Dr
- 12343 Mantilla Rd
- 12421 Senda Rd
- 12314 Lomica Dr
- 16348 Bernardo Oaks Dr
- 16301 Bernardo Oaks Dr
- 12324 Lomica Dr