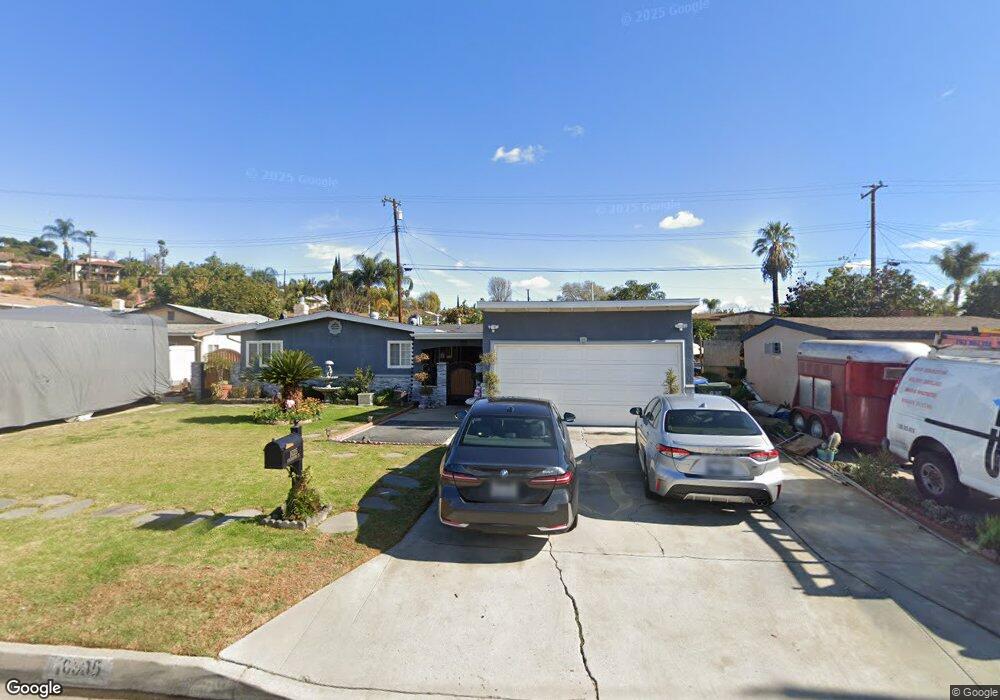
16335 Appleblossom St La Puente, CA 91744
Estimated Value: $674,000 - $734,000
4
Beds
2
Baths
1,176
Sq Ft
$595/Sq Ft
Est. Value
About This Home
This home is located at 16335 Appleblossom St, La Puente, CA 91744 and is currently estimated at $700,150, approximately $595 per square foot. 16335 Appleblossom St is a home located in Los Angeles County with nearby schools including Workman Elementary School, Sierra Vista Middle School, and La Puente High School.
Ownership History
Date
Name
Owned For
Owner Type
Purchase Details
Closed on
Sep 5, 2024
Sold by
Robles Oscar and Robles Rosa C
Bought by
Robles Revocable Trust and Robles
Current Estimated Value
Purchase Details
Closed on
Dec 11, 2003
Sold by
Robles Oscar
Bought by
Robles Oscar and Robles Rosa C
Purchase Details
Closed on
Oct 8, 2003
Sold by
Robles Rosa C
Bought by
Robles Oscar
Home Financials for this Owner
Home Financials are based on the most recent Mortgage that was taken out on this home.
Original Mortgage
$196,000
Interest Rate
6.27%
Mortgage Type
Purchase Money Mortgage
Purchase Details
Closed on
Aug 26, 2003
Sold by
Batac Luis Angelo and Batac Divina R
Bought by
Robles Oscar
Home Financials for this Owner
Home Financials are based on the most recent Mortgage that was taken out on this home.
Original Mortgage
$196,000
Interest Rate
6.27%
Mortgage Type
Purchase Money Mortgage
Create a Home Valuation Report for This Property
The Home Valuation Report is an in-depth analysis detailing your home's value as well as a comparison with similar homes in the area
Home Values in the Area
Average Home Value in this Area
Purchase History
| Date | Buyer | Sale Price | Title Company |
|---|---|---|---|
| Robles Revocable Trust | -- | None Listed On Document | |
| Robles Oscar | -- | -- | |
| Robles Oscar | -- | Ticor Title Co | |
| Robles Oscar | $250,000 | Ticor Title Co |
Source: Public Records
Mortgage History
| Date | Status | Borrower | Loan Amount |
|---|---|---|---|
| Previous Owner | Robles Oscar | $196,000 | |
| Closed | Robles Oscar | $24,500 |
Source: Public Records
Tax History Compared to Growth
Tax History
| Year | Tax Paid | Tax Assessment Tax Assessment Total Assessment is a certain percentage of the fair market value that is determined by local assessors to be the total taxable value of land and additions on the property. | Land | Improvement |
|---|---|---|---|---|
| 2025 | $4,540 | $355,428 | $234,871 | $120,557 |
| 2024 | $4,540 | $348,460 | $230,266 | $118,194 |
| 2023 | $4,426 | $341,628 | $225,751 | $115,877 |
| 2022 | $4,301 | $334,930 | $221,325 | $113,605 |
| 2021 | $4,224 | $328,364 | $216,986 | $111,378 |
| 2019 | $4,103 | $318,626 | $210,551 | $108,075 |
| 2018 | $3,961 | $312,379 | $206,423 | $105,956 |
| 2016 | $3,673 | $300,251 | $198,408 | $101,843 |
| 2015 | $3,605 | $295,742 | $195,428 | $100,314 |
| 2014 | $3,549 | $289,949 | $191,600 | $98,349 |
Source: Public Records
Map
Nearby Homes
- 16322 Main St
- 428 Ferrero Ln
- 16115 Central Ave
- 138 Banbridge Ave
- 16870 Wegman Dr
- 15900 Rowland St
- 15815 Fallen Leaf Rd
- 301 Whispering Pine Ln
- 15879 Hill St
- 656 Radstock Ave
- 17105 Main St
- 545 N 5th St
- 15732 Victoria Ave
- 1131 Glenelder Ave
- Sella 2 Plan at Sella
- Sella 1 Plan at Sella
- Sella 3 Plan at Sella
- 1146 Hinnen Ave
- 1154 Hinnen Ave
- 1158 Hinnen Ave
- 16341 Appleblossom St
- 16329 Appleblossom St
- 16368 Bamboo St
- 16360 Bamboo St
- 16374 Bamboo St
- 16347 Appleblossom St
- 16323 Appleblossom St
- 16354 Bamboo St
- 16380 Bamboo St
- 16334 Appleblossom St
- 16326 Appleblossom St
- 16342 Appleblossom St
- 16351 Appleblossom St
- 16315 Appleblossom St
- 16346 Bamboo St
- 16388 Bamboo St
- 16318 Appleblossom St
- 16350 Appleblossom St
- 16340 Bamboo St
- 16359 Appleblossom St