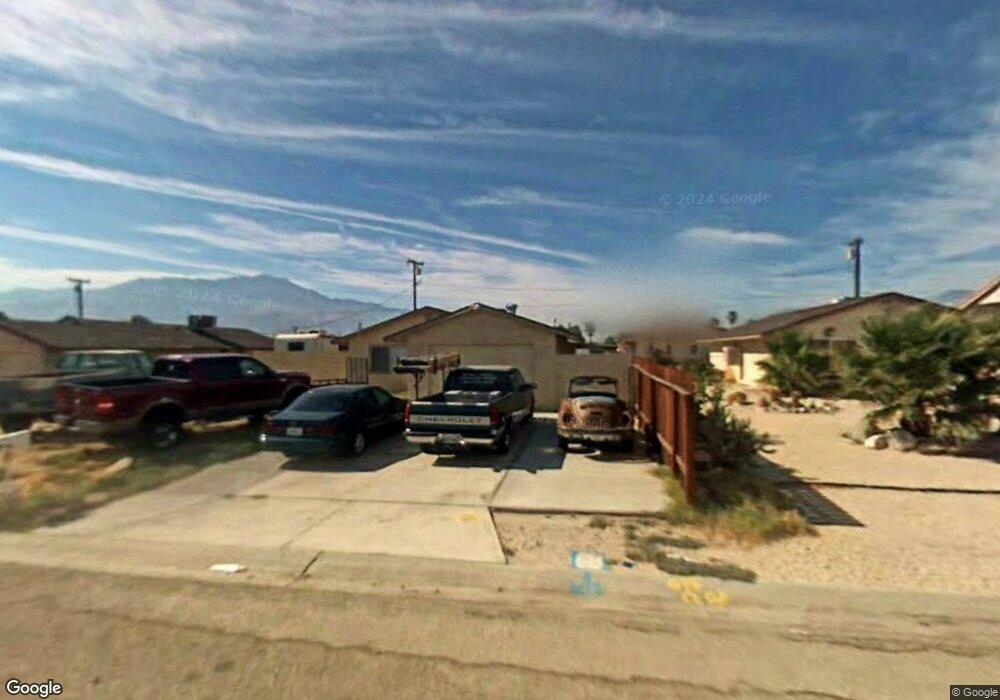
16335 Avenida Ramada Desert Hot Springs, CA 92240
Estimated Value: $186,000 - $334,000
3
Beds
1
Bath
998
Sq Ft
$289/Sq Ft
Est. Value
About This Home
This home is located at 16335 Avenida Ramada, Desert Hot Springs, CA 92240 and is currently estimated at $288,707, approximately $289 per square foot. 16335 Avenida Ramada is a home located in Riverside County with nearby schools including Bubbling Wells Elementary School, Desert Springs Middle School, and Desert Hot Springs High School.
Ownership History
Date
Name
Owned For
Owner Type
Purchase Details
Closed on
Sep 23, 2002
Sold by
Watts James G
Bought by
Venegas Raul R
Current Estimated Value
Home Financials for this Owner
Home Financials are based on the most recent Mortgage that was taken out on this home.
Original Mortgage
$94,141
Outstanding Balance
$38,608
Interest Rate
5.99%
Mortgage Type
FHA
Estimated Equity
$250,099
Purchase Details
Closed on
Dec 11, 2000
Sold by
Reed David J and Reed Brenda
Bought by
Watts James G
Home Financials for this Owner
Home Financials are based on the most recent Mortgage that was taken out on this home.
Original Mortgage
$59,450
Interest Rate
9.87%
Purchase Details
Closed on
Aug 3, 2000
Sold by
United State Department Agriculture
Bought by
Reed David J and Reed Brenda
Purchase Details
Closed on
Nov 15, 1999
Sold by
Miller James L and Miller Cindy R
Bought by
United States Of America and Farmers Home Admin
Create a Home Valuation Report for This Property
The Home Valuation Report is an in-depth analysis detailing your home's value as well as a comparison with similar homes in the area
Home Values in the Area
Average Home Value in this Area
Purchase History
| Date | Buyer | Sale Price | Title Company |
|---|---|---|---|
| Venegas Raul R | $95,000 | Lawyers Title Company | |
| Watts James G | $70,000 | First American Title Co | |
| Reed David J | $10,000 | First American Title Co | |
| United States Of America | $37,255 | Fidelity National Title Ins |
Source: Public Records
Mortgage History
| Date | Status | Borrower | Loan Amount |
|---|---|---|---|
| Open | Venegas Raul R | $94,141 | |
| Previous Owner | Watts James G | $59,450 |
Source: Public Records
Tax History Compared to Growth
Tax History
| Year | Tax Paid | Tax Assessment Tax Assessment Total Assessment is a certain percentage of the fair market value that is determined by local assessors to be the total taxable value of land and additions on the property. | Land | Improvement |
|---|---|---|---|---|
| 2025 | $1,889 | $137,560 | $17,365 | $120,195 |
| 2023 | $1,889 | $132,221 | $16,692 | $115,529 |
| 2022 | $2,526 | $129,629 | $16,365 | $113,264 |
| 2021 | $2,491 | $127,089 | $16,045 | $111,044 |
| 2020 | $2,415 | $125,787 | $15,881 | $109,906 |
| 2019 | $2,381 | $123,321 | $15,570 | $107,751 |
| 2018 | $2,321 | $120,904 | $15,265 | $105,639 |
| 2017 | $1,729 | $118,534 | $14,966 | $103,568 |
| 2016 | $2,157 | $116,211 | $14,673 | $101,538 |
| 2015 | $1,464 | $101,000 | $13,000 | $88,000 |
| 2014 | $1,282 | $85,000 | $11,000 | $74,000 |
Source: Public Records
Map
Nearby Homes
- 0 Avenida Garcia
- 8 Camino Aventura
- 16125 Via Vista
- 16347 Avenue Atezada
- 16295 Avenida Atezada
- 15707 Avenue Manzana
- 0 Avenida Atezada Unit 219128335DA
- 16094 Avenida Atezada
- 15900 Avenida Atezada
- 16264 Avenue Rambla
- 66735 El Dorado Place
- 16288 Avenue Rambla
- 16240 Avenida Rambla
- 16364 Avenue Rambla
- 16388 Avenue Rambla
- 0 Dillion Rd Unit 219129810PS
- 15435 Avenida Merced
- 66631 Thunderbird Ln
- 15483 Avenida Atezada
- Residence 3 Plan at Aventura Palms
- 16315 Avenida Ramada
- 16359 Avenida Ramada
- 16371 Avenida Ramada
- 16340 Avenida Ramada
- 16303 Avenida Ramada
- 16340 Monte Flora Ave
- 16340 Avenida Monteflora
- 16320 Avenida Monteflora
- 16360 Avenida Monteflora
- 16360 Avenue Monteflora
- 16360 Ave Monteflora
- 16360 Avenida Ramada
- 16300 Avenida Monteflora
- 16291 Avenida Ramada
- 16393 Avenida Ramada
- 16260 Avenida Monteflora
- 16277 Avenida Ramada
- 2019 Avenida Monte Flora
- 16420 Avenida Monteflora
- 16280 Avenida Monteflora