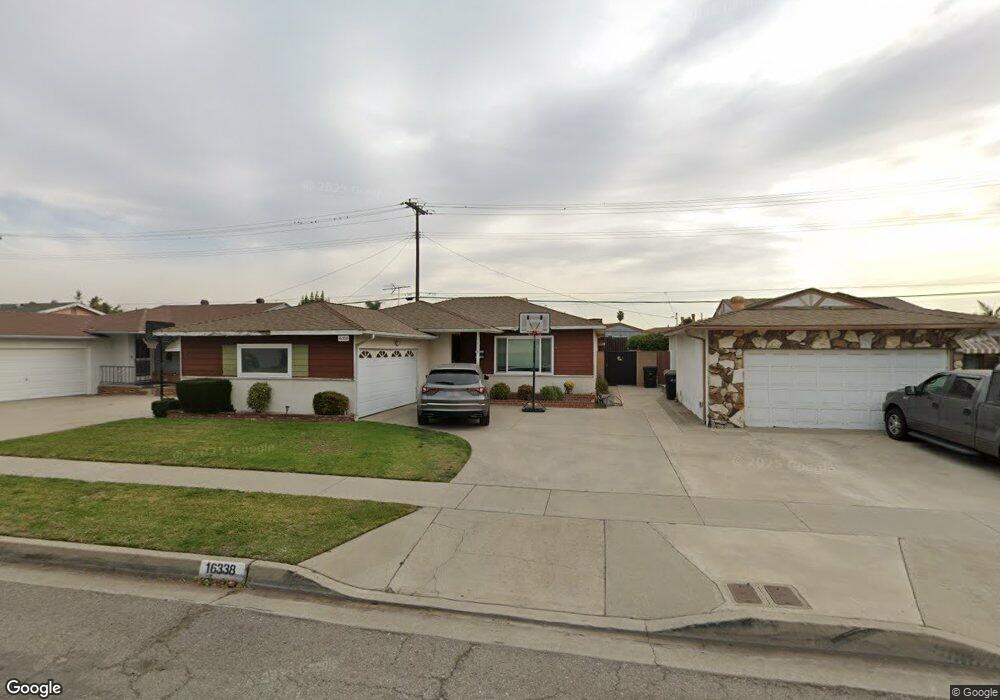
16338 Flallon Ave Norwalk, CA 90650
Estimated Value: $773,000 - $829,000
3
Beds
2
Baths
1,247
Sq Ft
$642/Sq Ft
Est. Value
About This Home
This home is located at 16338 Flallon Ave, Norwalk, CA 90650 and is currently estimated at $801,021, approximately $642 per square foot. 16338 Flallon Ave is a home located in Los Angeles County with nearby schools including Niemes (John H.) Elementary School, Ross (Faye) Middle School, and Gahr High School.
Ownership History
Date
Name
Owned For
Owner Type
Purchase Details
Closed on
Jun 19, 2009
Sold by
Papagno Paola Valeria
Bought by
Papagno Paola Valeria
Current Estimated Value
Home Financials for this Owner
Home Financials are based on the most recent Mortgage that was taken out on this home.
Original Mortgage
$238,000
Outstanding Balance
$150,858
Interest Rate
4.83%
Mortgage Type
New Conventional
Estimated Equity
$650,163
Purchase Details
Closed on
Sep 5, 2003
Sold by
Hill Elbert Cedric
Bought by
Papagno Paola Valeria
Purchase Details
Closed on
Jun 30, 2000
Sold by
Norma Dekker Trust Dekker Peter And Norma Trs
Bought by
Hill Elbert C
Home Financials for this Owner
Home Financials are based on the most recent Mortgage that was taken out on this home.
Original Mortgage
$181,800
Interest Rate
8.16%
Purchase Details
Closed on
Jul 8, 1993
Sold by
Dekker Peter
Bought by
Dekker Peter and Dekker Norma
Create a Home Valuation Report for This Property
The Home Valuation Report is an in-depth analysis detailing your home's value as well as a comparison with similar homes in the area
Home Values in the Area
Average Home Value in this Area
Purchase History
| Date | Buyer | Sale Price | Title Company |
|---|---|---|---|
| Papagno Paola Valeria | -- | Lawyers | |
| Papagno Paola Valeria | $30,000 | -- | |
| Hill Elbert C | $202,000 | Lawyers Title Company | |
| Dekker Peter | -- | -- | |
| Dekker Peter | -- | -- |
Source: Public Records
Mortgage History
| Date | Status | Borrower | Loan Amount |
|---|---|---|---|
| Open | Papagno Paola Valeria | $238,000 | |
| Previous Owner | Hill Elbert C | $181,800 |
Source: Public Records
Tax History Compared to Growth
Tax History
| Year | Tax Paid | Tax Assessment Tax Assessment Total Assessment is a certain percentage of the fair market value that is determined by local assessors to be the total taxable value of land and additions on the property. | Land | Improvement |
|---|---|---|---|---|
| 2025 | $4,877 | $381,787 | $271,059 | $110,728 |
| 2024 | $4,877 | $374,302 | $265,745 | $108,557 |
| 2023 | $4,724 | $366,964 | $260,535 | $106,429 |
| 2022 | $4,652 | $359,770 | $255,427 | $104,343 |
| 2021 | $4,544 | $352,717 | $250,419 | $102,298 |
| 2019 | $4,442 | $342,258 | $242,993 | $99,265 |
| 2018 | $4,084 | $335,548 | $238,229 | $97,319 |
| 2016 | $3,918 | $322,520 | $228,979 | $93,541 |
| 2015 | $3,867 | $317,676 | $225,540 | $92,136 |
| 2014 | $3,793 | $311,454 | $221,122 | $90,332 |
Source: Public Records
Map
Nearby Homes
- 11676 Chesterton St
- 16341 Pioneer Blvd Unit 11
- 11603 Faculty Dr
- 11558 Dartmouth Dr
- 11710 Arkansas St Unit A
- 11710 Arkansas St Unit D
- 11718 Arkansas St Unit C
- 11718 Arkansas St Unit E
- Plan 1 at Eginhouse
- Plan 3 at Eginhouse
- Plan 2 at Eginhouse
- 11838 166th St
- 16644 Pioneer Blvd
- 11871 162nd St
- 11818 167th St
- 11863 167th St
- 11542 169th St
- 11907 168th St
- 11864 Hayford St
- 16442 Elaine Ave
- 16342 Flallon Ave
- 16332 Flallon Ave
- 16348 Flallon Ave
- 16326 Flallon Ave
- 16352 Flallon Ave
- 16322 Flallon Ave
- 11675 Faculty Dr
- 11670 Chesterton St
- 16402 Flallon Ave
- 16318 Flallon Ave
- 11675 Chesterton St
- 11671 Faculty Dr
- 11666 Chesterton St
- 11671 Chesterton St
- 11665 Faculty Dr
- 16408 Flallon Ave
- 16312 Flallon Ave
- 11674 Faculty Dr
- 16315 Flallon Ave
- 11665 Chesterton St