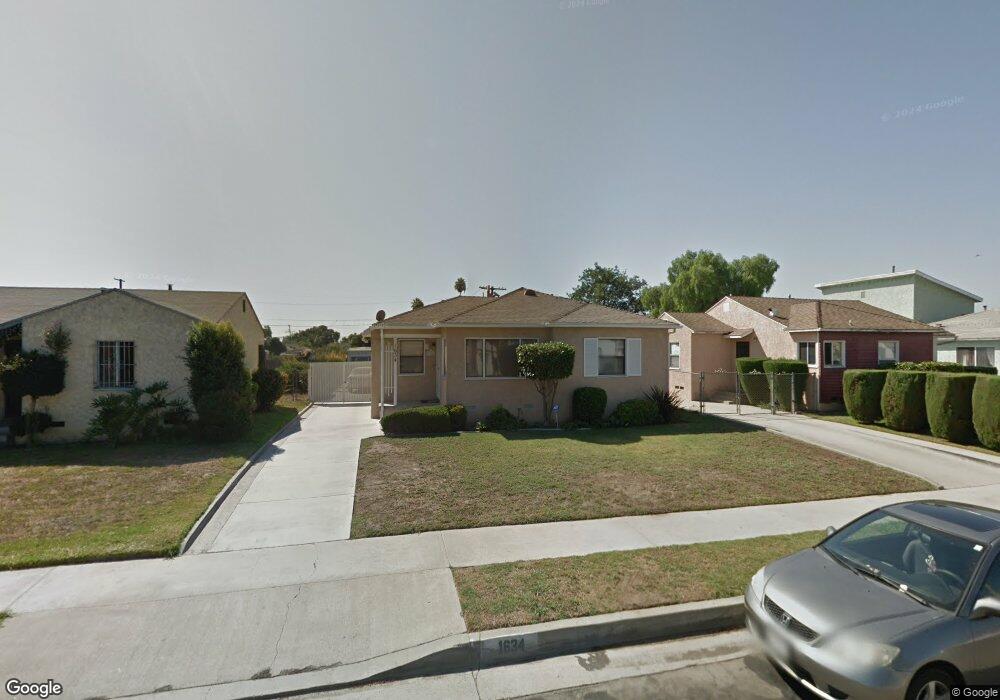
1634 E 124th St Compton, CA 90222
Estimated Value: $646,000 - $753,675
3
Beds
2
Baths
1,373
Sq Ft
$510/Sq Ft
Est. Value
About This Home
This home is located at 1634 E 124th St, Compton, CA 90222 and is currently estimated at $699,919, approximately $509 per square foot. 1634 E 124th St is a home located in Los Angeles County with nearby schools including Carver Elementary School, Bunche Middle School, and Centennial High School.
Ownership History
Date
Name
Owned For
Owner Type
Purchase Details
Closed on
Nov 21, 2019
Sold by
Torres Adrian Carballido and Beerra Marcia Socorro
Bought by
Carballido Adrian
Current Estimated Value
Home Financials for this Owner
Home Financials are based on the most recent Mortgage that was taken out on this home.
Original Mortgage
$375,000
Outstanding Balance
$329,903
Interest Rate
3.6%
Mortgage Type
New Conventional
Estimated Equity
$370,016
Purchase Details
Closed on
Feb 17, 2017
Sold by
Thompson Brian A
Bought by
Torres Adrian Carballido and Becerra Marcia Socorro
Home Financials for this Owner
Home Financials are based on the most recent Mortgage that was taken out on this home.
Original Mortgage
$371,153
Interest Rate
4.99%
Mortgage Type
FHA
Purchase Details
Closed on
Aug 17, 2007
Sold by
Thompson Naomi A
Bought by
Thompson Naomi Alverna and The Naomi Alverna Thompson Revocable Tr
Create a Home Valuation Report for This Property
The Home Valuation Report is an in-depth analysis detailing your home's value as well as a comparison with similar homes in the area
Home Values in the Area
Average Home Value in this Area
Purchase History
| Date | Buyer | Sale Price | Title Company |
|---|---|---|---|
| Carballido Adrian | -- | Wfg National Title Company | |
| Torres Adrian Carballido | $378,000 | Fidelity Title Company | |
| Thompson Naomi Alverna | -- | None Available |
Source: Public Records
Mortgage History
| Date | Status | Borrower | Loan Amount |
|---|---|---|---|
| Open | Carballido Adrian | $375,000 | |
| Previous Owner | Torres Adrian Carballido | $371,153 |
Source: Public Records
Tax History
| Year | Tax Paid | Tax Assessment Tax Assessment Total Assessment is a certain percentage of the fair market value that is determined by local assessors to be the total taxable value of land and additions on the property. | Land | Improvement |
|---|---|---|---|---|
| 2025 | $6,434 | $486,661 | $385,870 | $100,791 |
| 2024 | $6,434 | $477,119 | $378,304 | $98,815 |
| 2023 | $6,354 | $467,765 | $370,887 | $96,878 |
| 2022 | $5,907 | $458,594 | $363,615 | $94,979 |
| 2021 | $6,026 | $449,603 | $356,486 | $93,117 |
| 2020 | $5,399 | $401,134 | $264,770 | $136,364 |
| 2019 | $5,353 | $393,270 | $259,579 | $133,691 |
| 2018 | $5,190 | $385,560 | $254,490 | $131,070 |
| 2016 | $1,023 | $39,297 | $13,225 | $26,072 |
| 2015 | $993 | $38,708 | $13,027 | $25,681 |
| 2014 | $992 | $37,950 | $12,772 | $25,178 |
Source: Public Records
Map
Nearby Homes
- 1522 E 123rd St
- 1950 N Bloom Dr
- 1644 E 122nd St
- 1563 E 119th St
- 12400 S Wilmington Ave
- 11847 Alabama St
- 917 W 130th St
- 1223 E 124th St
- 2010 E 122nd St
- 1301 W 132nd St
- 12119 Alvaro St
- 11727 Alabama St
- 810 W 133rd St
- 1645 E 117th St
- 850 W 132nd St
- 2207 N Anzac Ave
- 12029 Belhaven St
- 12106 S Willowbrook Ave
- 12116 S Willowbrook Ave
- 1422 E Imperial Hwy
- 1638 E 124th St
- 1630 E 124th St
- 1642 E 124th St
- 1624 E 124th St
- 1646 E 124th St
- 1618 E 124th St
- 1633 E 124th St
- 1652 E 124th St
- 1629 E 124th St
- 1639 E 124th St
- 1625 E 124th St
- 1643 E 124th St
- 1656 E 124th St
- 1608 E 124th St
- 1619 E 124th St
- 1647 E 124th St
- 1615 E 124th St
- 1653 E 124th St
- 1639 E 126th St
- 1629 E 126th St
Your Personal Tour Guide
Ask me questions while you tour the home.