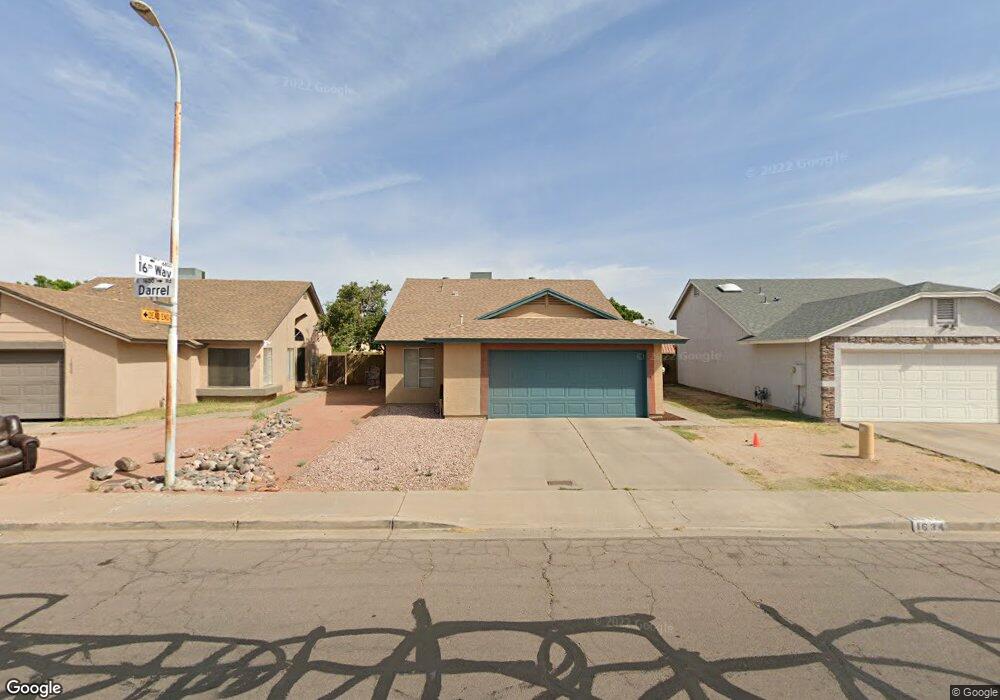
1634 E Darrel Rd Phoenix, AZ 85042
South Mountain NeighborhoodEstimated Value: $341,000 - $344,000
3
Beds
2
Baths
1,199
Sq Ft
$286/Sq Ft
Est. Value
About This Home
This home is located at 1634 E Darrel Rd, Phoenix, AZ 85042 and is currently estimated at $342,927, approximately $286 per square foot. 1634 E Darrel Rd is a home located in Maricopa County with nearby schools including T G Barr School, South Mountain High School, and Phoenix Coding Academy.
Ownership History
Date
Name
Owned For
Owner Type
Purchase Details
Closed on
Apr 2, 2009
Sold by
Bank Of New York
Bought by
Morfin Carlos D
Current Estimated Value
Home Financials for this Owner
Home Financials are based on the most recent Mortgage that was taken out on this home.
Original Mortgage
$63,723
Interest Rate
4.82%
Mortgage Type
FHA
Purchase Details
Closed on
Dec 16, 2008
Sold by
Taggart Michael A
Bought by
Bank Of New York
Purchase Details
Closed on
Oct 17, 2002
Sold by
Careaga Miguel
Bought by
Taggart Michael A
Home Financials for this Owner
Home Financials are based on the most recent Mortgage that was taken out on this home.
Original Mortgage
$100,800
Interest Rate
7.5%
Mortgage Type
New Conventional
Create a Home Valuation Report for This Property
The Home Valuation Report is an in-depth analysis detailing your home's value as well as a comparison with similar homes in the area
Home Values in the Area
Average Home Value in this Area
Purchase History
| Date | Buyer | Sale Price | Title Company |
|---|---|---|---|
| Morfin Carlos D | $64,900 | First American Title Ins Co | |
| Bank Of New York | $84,575 | First American Title | |
| Taggart Michael A | $112,000 | Security Title Agency |
Source: Public Records
Mortgage History
| Date | Status | Borrower | Loan Amount |
|---|---|---|---|
| Previous Owner | Morfin Carlos D | $63,723 | |
| Previous Owner | Taggart Michael A | $100,800 |
Source: Public Records
Tax History
| Year | Tax Paid | Tax Assessment Tax Assessment Total Assessment is a certain percentage of the fair market value that is determined by local assessors to be the total taxable value of land and additions on the property. | Land | Improvement |
|---|---|---|---|---|
| 2025 | $1,012 | $7,488 | -- | -- |
| 2024 | $956 | $7,131 | -- | -- |
| 2023 | $956 | $23,550 | $4,710 | $18,840 |
| 2022 | $936 | $18,050 | $3,610 | $14,440 |
| 2021 | $966 | $15,770 | $3,150 | $12,620 |
| 2020 | $954 | $14,950 | $2,990 | $11,960 |
| 2019 | $921 | $13,100 | $2,620 | $10,480 |
| 2018 | $895 | $11,460 | $2,290 | $9,170 |
| 2017 | $834 | $9,430 | $1,880 | $7,550 |
| 2016 | $791 | $7,970 | $1,590 | $6,380 |
| 2015 | $735 | $6,910 | $1,380 | $5,530 |
Source: Public Records
Map
Nearby Homes
- 1653 E Vineyard Rd
- 1515 E Apollo Rd
- 1507 E Apollo Rd
- 1516 E Fremont Rd
- 1329 E Irwin Ave
- 6408 S 19th Place
- 1317 E Fremont Rd
- 7312 S 13th Way
- 1817 E Donner Dr
- 7514 S 14th St
- 7609 S 18th Way
- 7611 S 15th St
- 7527 S 13th Place
- 1717 E Beautiful Ln
- 6025 S 13th St
- 6630 S 11th St Unit 1
- 1634 E Harwell Rd
- 2031 E Valencia Dr
- 1813 E Beverly Rd
- 6602 S 22nd Place
- 1638 E Darrel Rd
- 1630 E Darrel Rd
- 1642 E Darrel Rd Unit 1
- 1626 E Darrel Rd
- 1637 E Vineyard Rd
- 1631 E Vineyard Rd
- 1643 E Vineyard Rd Unit 1
- 1646 E Darrel Rd
- 1625 E Vineyard Rd
- 6821 S 16th Way
- 6817 S 16th Place
- 6822 S 16th Way
- 1650 E Darrel Rd
- 1649 E Vineyard Rd
- 1619 E Vineyard Rd
- 6825 S 16th Way
- 6809 S 16th Place
- 1654 E Darrel Rd
- 6822 S 17th St
- 1613 E Vineyard Rd
Your Personal Tour Guide
Ask me questions while you tour the home.