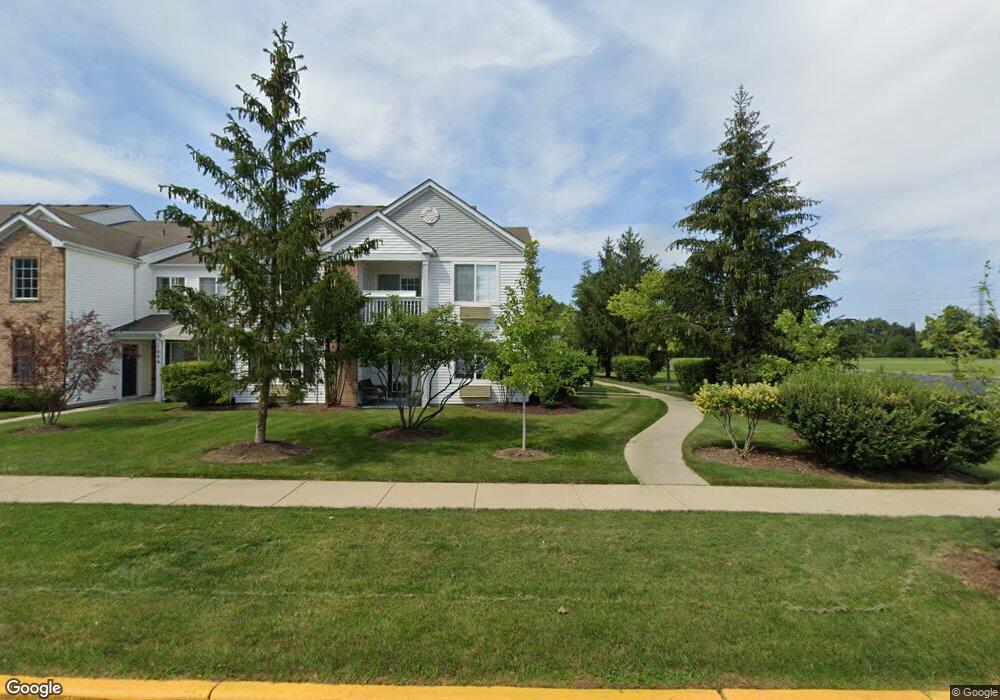
1634 Mcclure Rd Unit 804 Aurora, IL 60505
Indian Creek NeighborhoodEstimated Value: $187,000 - $234,000
2
Beds
2
Baths
1,049
Sq Ft
$201/Sq Ft
Est. Value
About This Home
This home is located at 1634 Mcclure Rd Unit 804, Aurora, IL 60505 and is currently estimated at $210,815, approximately $200 per square foot. 1634 Mcclure Rd Unit 804 is a home located in Kane County with nearby schools including Mabel O Donnell Elementary School, Simmons Middle School, and East Aurora High School.
Ownership History
Date
Name
Owned For
Owner Type
Purchase Details
Closed on
Nov 29, 2011
Sold by
Federal Home Loan Mortgage Corporation
Bought by
Subramanian Karhik
Current Estimated Value
Purchase Details
Closed on
Jun 20, 2011
Sold by
Granholm Marc C
Bought by
Federal Home Loan Mortgage Corp
Purchase Details
Closed on
Jul 28, 2006
Sold by
Dowd James M and Dowd Jean A
Bought by
Granholm Marc C
Home Financials for this Owner
Home Financials are based on the most recent Mortgage that was taken out on this home.
Original Mortgage
$113,600
Interest Rate
6.83%
Mortgage Type
Purchase Money Mortgage
Purchase Details
Closed on
Feb 1, 2005
Sold by
Centex Homes
Bought by
Dowd James M and Dowd Jean A
Home Financials for this Owner
Home Financials are based on the most recent Mortgage that was taken out on this home.
Original Mortgage
$81,064
Interest Rate
5.37%
Mortgage Type
Purchase Money Mortgage
Create a Home Valuation Report for This Property
The Home Valuation Report is an in-depth analysis detailing your home's value as well as a comparison with similar homes in the area
Home Values in the Area
Average Home Value in this Area
Purchase History
| Date | Buyer | Sale Price | Title Company |
|---|---|---|---|
| Subramanian Karhik | $64,000 | None Available | |
| Federal Home Loan Mortgage Corp | -- | None Available | |
| Granholm Marc C | $142,000 | First American Title | |
| Dowd James M | $125,000 | Chicago Title Insurance Comp |
Source: Public Records
Mortgage History
| Date | Status | Borrower | Loan Amount |
|---|---|---|---|
| Previous Owner | Granholm Marc C | $113,600 | |
| Previous Owner | Dowd James M | $81,064 |
Source: Public Records
Tax History Compared to Growth
Tax History
| Year | Tax Paid | Tax Assessment Tax Assessment Total Assessment is a certain percentage of the fair market value that is determined by local assessors to be the total taxable value of land and additions on the property. | Land | Improvement |
|---|---|---|---|---|
| 2024 | $3,581 | $52,235 | $5,302 | $46,933 |
| 2023 | $3,488 | $46,671 | $4,737 | $41,934 |
| 2022 | $3,235 | $42,583 | $4,322 | $38,261 |
| 2021 | $3,201 | $39,645 | $4,024 | $35,621 |
| 2020 | $3,063 | $36,825 | $3,738 | $33,087 |
| 2019 | $3,006 | $34,119 | $3,463 | $30,656 |
| 2018 | $2,783 | $30,558 | $3,203 | $27,355 |
| 2017 | $2,572 | $26,229 | $2,951 | $23,278 |
| 2016 | $2,451 | $23,292 | $2,530 | $20,762 |
| 2015 | -- | $19,317 | $2,176 | $17,141 |
| 2014 | -- | $18,579 | $2,093 | $16,486 |
| 2013 | -- | $19,397 | $2,063 | $17,334 |
Source: Public Records
Map
Nearby Homes
- 1648 Mcclure Rd Unit 814
- 1425 Mcclure Rd Unit 10
- Lot 1 Reckinger Rd
- 1826 N Farnsworth Ave
- 1942 Tall Oaks Dr Unit 1A
- 1750 N Marywood Ave Unit 315
- 1771 Briarheath Dr
- 0000 N Farnsworth Ave
- 1953 Charles Ln Unit 1953
- 1176 Heathrow Ln
- 1671 Sheffer Rd
- 1148 Drury Ln
- 1129 Drury Ln
- 2315 Nan St
- 2428 Ridgewood Ct
- 1923 Schomer Ct
- 970 Waterside Ct
- 1147 Rural St Unit 41
- 2762 Shetland Ln
- 451 Turner Rd
- 1650 Mcclure Rd Unit 812
- 1646 Mcclure Rd Unit 811
- 1652 Mcclure Rd Unit 813
- 1630 Mcclure Rd Unit 83
- 1630 Mcclure Rd Unit 1630
- 1622 Mcclure Rd Unit 81
- 1622 Mcclure Rd Unit 1622
- 1636 Mcclure Rd Unit 805
- 1632 Mcclure Rd Unit 806
- 1642 Mcclure Rd Unit 810
- 1642 Mcclure Rd Unit 1642
- 1626 Mcclure Rd Unit 82
- 1626 Mcclure Rd
- 1644 Mcclure Rd Unit 815
- 1628 Mcclure Rd Unit 807
- 1628 Mcclure Rd Unit 1628
- 1638 Mcclure Rd Unit 809
- 1638 Mcclure Rd Unit 1638
- 1638 Mcclure Rd
- 1640 Mcclure Rd Unit 816