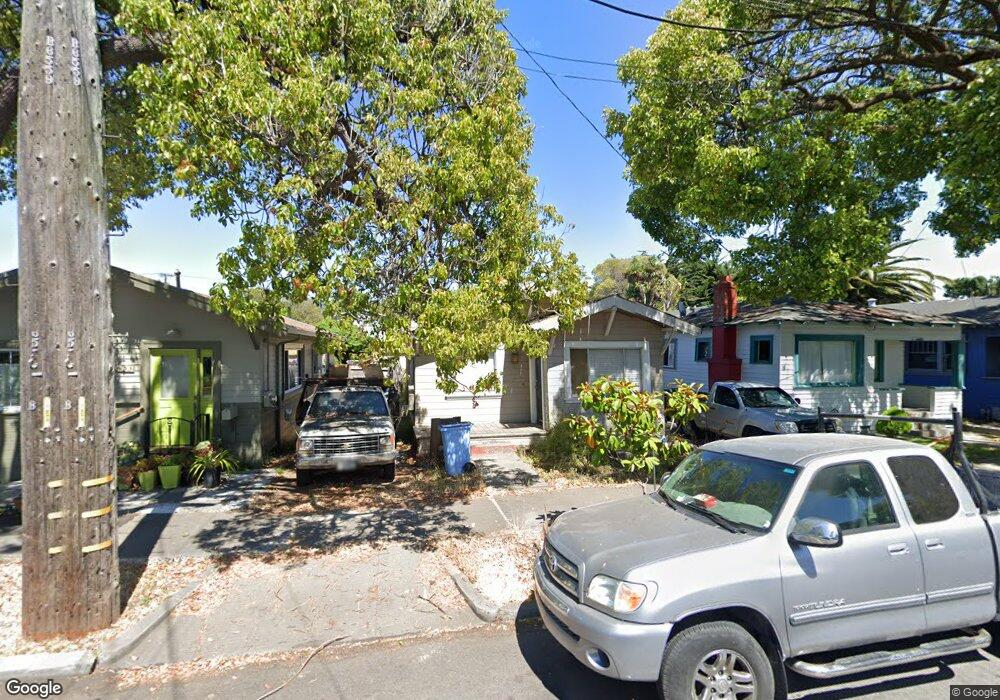
1635 9th St Berkeley, CA 94710
West Berkeley NeighborhoodEstimated Value: $735,000 - $1,090,000
2
Beds
1
Bath
972
Sq Ft
$939/Sq Ft
Est. Value
About This Home
This home is located at 1635 9th St, Berkeley, CA 94710 and is currently estimated at $912,742, approximately $939 per square foot. 1635 9th St is a home located in Alameda County with nearby schools including Rosa Parks Elementary School, Ruth Acty Elementary, and Berkeley Arts Magnet at Whittier School.
Ownership History
Date
Name
Owned For
Owner Type
Purchase Details
Closed on
Jul 29, 2002
Sold by
Chausee Paul T and Donmon Renee C
Bought by
Sandoval Felipe
Current Estimated Value
Home Financials for this Owner
Home Financials are based on the most recent Mortgage that was taken out on this home.
Original Mortgage
$148,000
Outstanding Balance
$59,572
Interest Rate
5.87%
Estimated Equity
$853,170
Purchase Details
Closed on
Feb 8, 2002
Sold by
Nesby Stancy B
Bought by
Chaussee Paul T and Donmon Renee C
Home Financials for this Owner
Home Financials are based on the most recent Mortgage that was taken out on this home.
Original Mortgage
$114,000
Interest Rate
7.13%
Create a Home Valuation Report for This Property
The Home Valuation Report is an in-depth analysis detailing your home's value as well as a comparison with similar homes in the area
Home Values in the Area
Average Home Value in this Area
Purchase History
| Date | Buyer | Sale Price | Title Company |
|---|---|---|---|
| Sandoval Felipe | $185,000 | First American Title Guarant | |
| Chaussee Paul T | $114,000 | Placer Title Company |
Source: Public Records
Mortgage History
| Date | Status | Borrower | Loan Amount |
|---|---|---|---|
| Open | Sandoval Felipe | $148,000 | |
| Previous Owner | Chaussee Paul T | $114,000 |
Source: Public Records
Tax History
| Year | Tax Paid | Tax Assessment Tax Assessment Total Assessment is a certain percentage of the fair market value that is determined by local assessors to be the total taxable value of land and additions on the property. | Land | Improvement |
|---|---|---|---|---|
| 2025 | $4,804 | $267,916 | $80,375 | $187,541 |
| 2024 | $4,804 | $262,664 | $78,799 | $183,865 |
| 2023 | $4,697 | $257,515 | $77,254 | $180,261 |
| 2022 | $4,599 | $252,467 | $75,740 | $176,727 |
| 2021 | $4,596 | $247,518 | $74,255 | $173,263 |
| 2020 | $4,335 | $244,981 | $73,494 | $171,487 |
| 2019 | $4,145 | $240,178 | $72,053 | $168,125 |
| 2018 | $4,067 | $235,471 | $70,641 | $164,830 |
| 2017 | $3,895 | $230,855 | $69,256 | $161,599 |
| 2016 | $3,750 | $226,330 | $67,899 | $158,431 |
| 2015 | $3,698 | $222,931 | $66,879 | $156,052 |
| 2014 | $3,667 | $218,565 | $65,569 | $152,996 |
Source: Public Records
Map
Nearby Homes
- 998 Virginia St
- 1504 10th St
- 1609 Kains Ave
- 921 Jones St
- 1447 Kains Ave
- 817 Jones St
- 1128 Delaware St
- 817 Delaware St
- 1406 San Pablo Ave Unit A
- 1728 Curtis St
- 1450 Curtis St
- 1207 Francisco St
- 1207 Francisco St Unit 2
- 1450 Fourth St Unit 5
- 1919 Curtis St
- 1322 Virginia St
- 0 Camelia St Unit 41104882
- 1213 San Pablo Ave
- 1050 Allston Way
- 2220 7th St
Your Personal Tour Guide
Ask me questions while you tour the home.