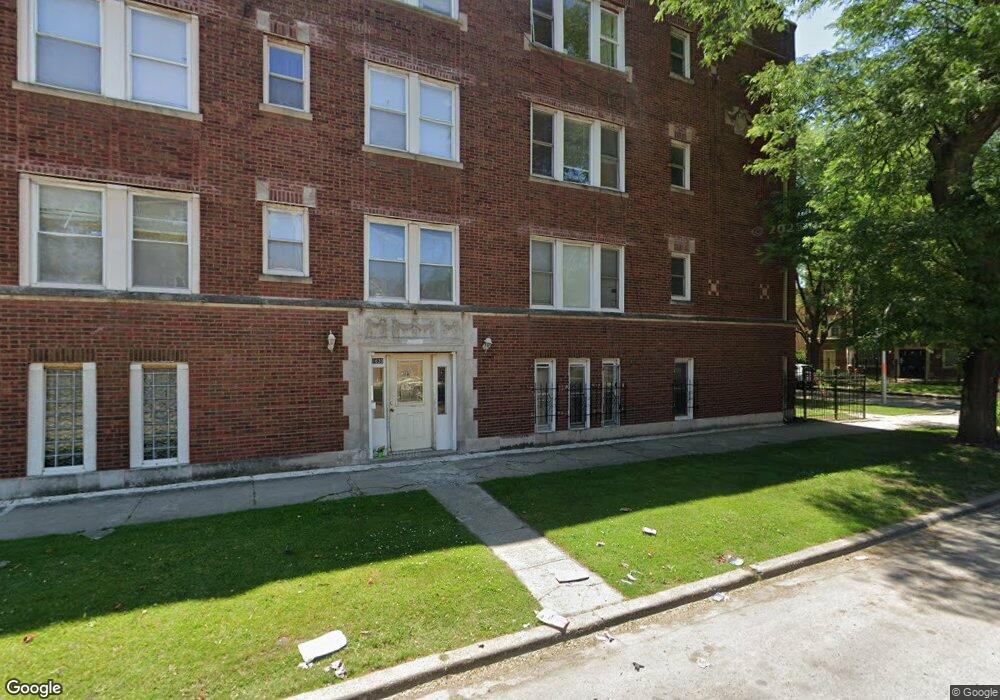
1635 E 77th St Unit 16353 Chicago, IL 60649
South Shore NeighborhoodEstimated Value: $68,000 - $126,000
2
Beds
1
Bath
850
Sq Ft
$102/Sq Ft
Est. Value
About This Home
This home is located at 1635 E 77th St Unit 16353, Chicago, IL 60649 and is currently estimated at $86,811, approximately $102 per square foot. 1635 E 77th St Unit 16353 is a home located in Cook County with nearby schools including Mann Elementary School, St Paul Lutheran School, and Muhammad University.
Ownership History
Date
Name
Owned For
Owner Type
Purchase Details
Closed on
May 1, 2023
Sold by
Tolbert Parise
Bought by
Mrc Holdings Llc
Current Estimated Value
Purchase Details
Closed on
Jun 2, 2022
Sold by
Yarbrough Karen A
Bought by
Tolbert Parise
Purchase Details
Closed on
Sep 29, 2005
Sold by
Gashunin Alexander
Bought by
Mcgee Shaunta
Home Financials for this Owner
Home Financials are based on the most recent Mortgage that was taken out on this home.
Original Mortgage
$99,500
Interest Rate
5.88%
Mortgage Type
New Conventional
Purchase Details
Closed on
Nov 29, 2004
Sold by
Morning Star Development Corp
Bought by
Gashunin Alexander
Home Financials for this Owner
Home Financials are based on the most recent Mortgage that was taken out on this home.
Original Mortgage
$87,300
Interest Rate
7.1%
Mortgage Type
Purchase Money Mortgage
Create a Home Valuation Report for This Property
The Home Valuation Report is an in-depth analysis detailing your home's value as well as a comparison with similar homes in the area
Home Values in the Area
Average Home Value in this Area
Purchase History
| Date | Buyer | Sale Price | Title Company |
|---|---|---|---|
| Mrc Holdings Llc | $57,500 | None Listed On Document | |
| Tolbert Parise | -- | None Listed On Document | |
| Mcgee Shaunta | $99,500 | Multiple | |
| Gashunin Alexander | $97,000 | Multiple |
Source: Public Records
Mortgage History
| Date | Status | Borrower | Loan Amount |
|---|---|---|---|
| Previous Owner | Mcgee Shaunta | $99,500 | |
| Previous Owner | Gashunin Alexander | $87,300 |
Source: Public Records
Tax History
| Year | Tax Paid | Tax Assessment Tax Assessment Total Assessment is a certain percentage of the fair market value that is determined by local assessors to be the total taxable value of land and additions on the property. | Land | Improvement |
|---|---|---|---|---|
| 2025 | -- | $5,512 | $304 | $5,208 |
| 2024 | -- | $5,512 | $304 | $5,208 |
| 2023 | -- | $2,500 | $507 | $1,993 |
| 2022 | $0 | $2,500 | $507 | $1,993 |
| 2021 | $339 | $2,499 | $507 | $1,992 |
| 2020 | $339 | $4,624 | $365 | $4,259 |
| 2019 | $339 | $5,118 | $365 | $4,753 |
| 2018 | $875 | $7,865 | $365 | $7,500 |
| 2017 | $892 | $7,519 | $324 | $7,195 |
| 2016 | $1,006 | $7,519 | $324 | $7,195 |
| 2015 | $897 | $7,519 | $324 | $7,195 |
| 2014 | $1,292 | $9,534 | $273 | $9,261 |
| 2013 | $1,256 | $9,534 | $273 | $9,261 |
Source: Public Records
Map
Nearby Homes
- 7713 S Cornell Ave
- 7731 S Cornell Ave
- 7652 S Cornell Ave
- 7639 S Cornell Ave
- 7712 S Ridgeland Ave
- 7650 S Cregier Ave
- 7644 S Constance Ave
- 7515 S East End Ave
- 1758 E 79th St
- 7521 S Ridgeland Ave
- 7836 S Constance Ave
- 7642 S Dante Ave
- 7918 S Anthony Ave
- 7930 S Anthony Ave
- 1412 E 76th St
- 7955 S Ridgeland Ave
- 7847 S Bennett Ave
- 7935 S Blackstone Ave
- 7514 S Dante Ave
- 7629 S Euclid Ave
- 1635 E 77th St Unit 16351
- 1635 E 77th St Unit 16352
- 1635 E 77th St Unit 3
- 1635 E 77th St Unit 2
- 1635 E 77th St
- 7701 S Cornell Ave Unit 77011
- 7701 S Cornell Ave Unit 77014
- 7701 S Cornell Ave Unit 77013
- 7701 S Cornell Ave Unit 77012
- 7701 S Cornell Ave Unit 2
- 1637 E 77th St Unit 16372
- 1637 E 77th St Unit 16371
- 1637 E 77th St Unit 16373
- 1637 E 77th St Unit 3
- 1637 E 77th St Unit 2
- 1637 E 77th St Unit 1
- 1637 E 77th St Unit 1D
- 7703 S Cornell Ave Unit 77032
- 7703 S Cornell Ave Unit 77031
- 7703 S Cornell Ave Unit 77033
Your Personal Tour Guide
Ask me questions while you tour the home.