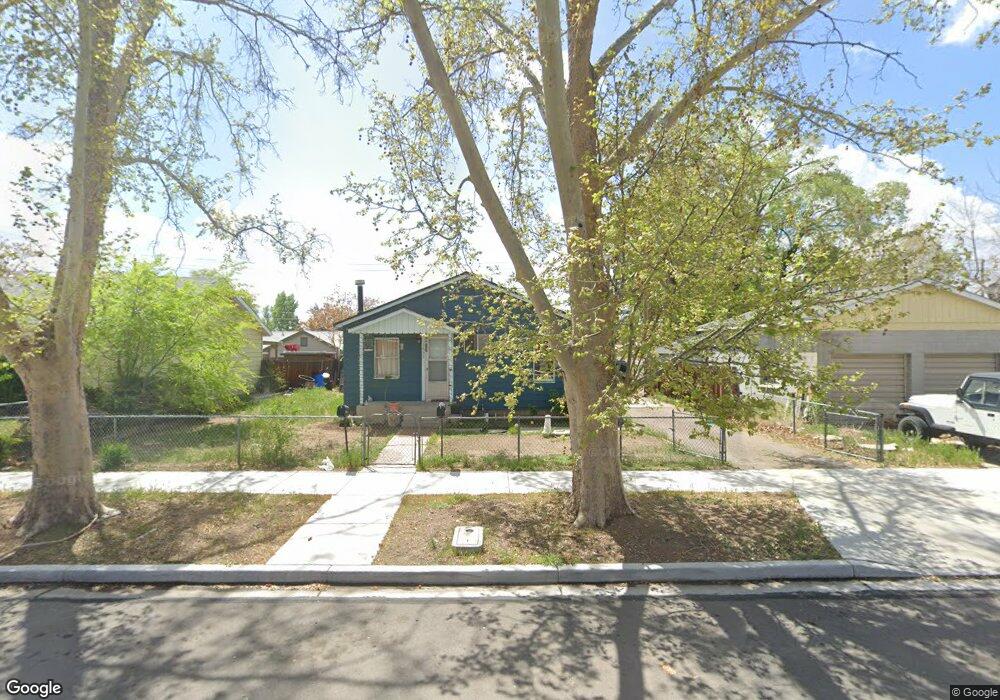
1635 H St Sparks, NV 89431
Downtown Sparks NeighborhoodEstimated Value: $351,000 - $514,000
4
Beds
2
Baths
1,902
Sq Ft
$228/Sq Ft
Est. Value
About This Home
This home is located at 1635 H St, Sparks, NV 89431 and is currently estimated at $433,246, approximately $227 per square foot. 1635 H St is a home located in Washoe County with nearby schools including Robert Mitchell Elementary School, Sparks Middle School, and Sparks High School.
Ownership History
Date
Name
Owned For
Owner Type
Purchase Details
Closed on
May 5, 2021
Sold by
Veasley Jeffrey
Bought by
Jdar Llc
Current Estimated Value
Home Financials for this Owner
Home Financials are based on the most recent Mortgage that was taken out on this home.
Original Mortgage
$271,500
Outstanding Balance
$246,047
Interest Rate
3.1%
Mortgage Type
Commercial
Estimated Equity
$187,199
Purchase Details
Closed on
Aug 11, 2016
Sold by
Saylor Linda K
Bought by
Veasley Jeffrey
Purchase Details
Closed on
Apr 7, 2003
Sold by
Irwin Mark M and Irwin Laurie J
Bought by
Saylor Linda K
Home Financials for this Owner
Home Financials are based on the most recent Mortgage that was taken out on this home.
Original Mortgage
$136,000
Interest Rate
5.71%
Mortgage Type
Unknown
Purchase Details
Closed on
May 20, 1996
Sold by
Gregor Paul A
Bought by
Irwin Mark M and Irwin Laurie J
Home Financials for this Owner
Home Financials are based on the most recent Mortgage that was taken out on this home.
Original Mortgage
$97,600
Interest Rate
7.12%
Create a Home Valuation Report for This Property
The Home Valuation Report is an in-depth analysis detailing your home's value as well as a comparison with similar homes in the area
Home Values in the Area
Average Home Value in this Area
Purchase History
| Date | Buyer | Sale Price | Title Company |
|---|---|---|---|
| Jdar Llc | $121,666 | First Centennial Reno | |
| Veasley Jeffrey | -- | First Centennial Reno | |
| Veasley Jeffrey | $88,500 | None Available | |
| Saylor Linda K | $170,000 | Stewart Title Of Northern Nv | |
| Irwin Mark M | $122,000 | Founders Title Co |
Source: Public Records
Mortgage History
| Date | Status | Borrower | Loan Amount |
|---|---|---|---|
| Open | Jdar Llc | $271,500 | |
| Previous Owner | Saylor Linda K | $136,000 | |
| Previous Owner | Irwin Mark M | $97,600 |
Source: Public Records
Tax History Compared to Growth
Tax History
| Year | Tax Paid | Tax Assessment Tax Assessment Total Assessment is a certain percentage of the fair market value that is determined by local assessors to be the total taxable value of land and additions on the property. | Land | Improvement |
|---|---|---|---|---|
| 2025 | $1,054 | $66,784 | $41,720 | $25,064 |
| 2024 | $1,054 | $62,103 | $38,710 | $23,393 |
| 2023 | $1,024 | $60,939 | $39,305 | $21,634 |
| 2022 | $948 | $50,538 | $32,865 | $17,673 |
| 2021 | $1,792 | $42,583 | $25,375 | $17,208 |
| 2020 | $2,146 | $43,127 | $26,250 | $16,877 |
| 2019 | $3,010 | $38,480 | $22,470 | $16,010 |
| 2018 | $837 | $30,882 | $15,190 | $15,692 |
| 2017 | $2,159 | $29,412 | $14,000 | $15,412 |
| 2016 | $1,889 | $26,639 | $11,200 | $15,439 |
| 2015 | $781 | $23,368 | $8,050 | $15,318 |
| 2014 | $758 | $21,421 | $7,000 | $14,421 |
| 2013 | -- | $20,213 | $6,160 | $14,053 |
Source: Public Records
Map
Nearby Homes