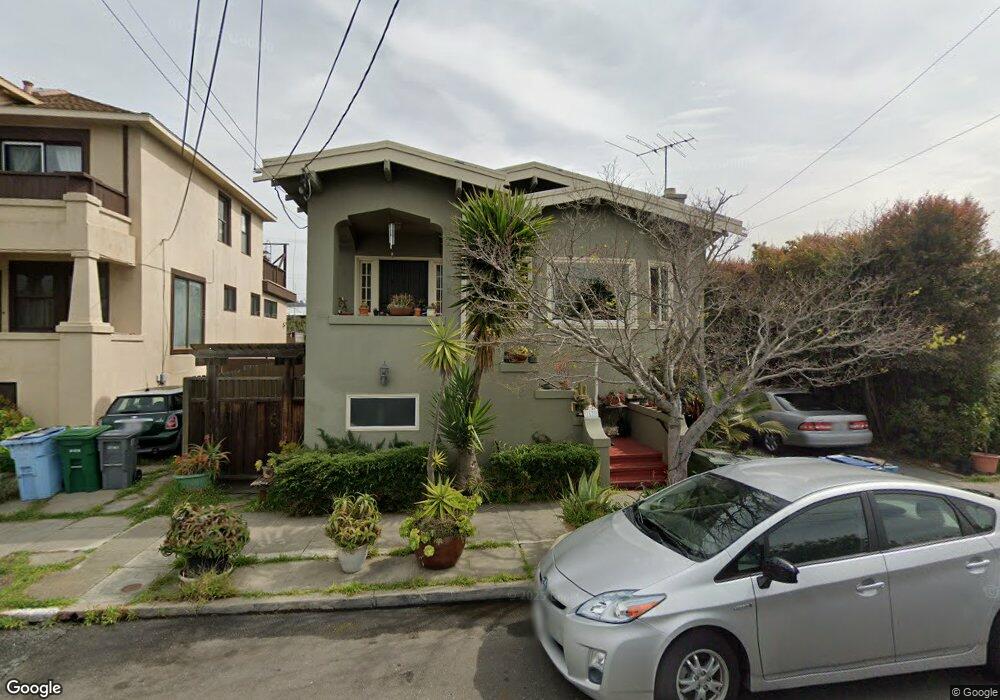
1635 Kains Ave Berkeley, CA 94702
West Berkeley NeighborhoodEstimated Value: $989,000 - $1,622,178
Studio
--
Bath
2,692
Sq Ft
$492/Sq Ft
Est. Value
About This Home
This home is located at 1635 Kains Ave, Berkeley, CA 94702 and is currently estimated at $1,324,795, approximately $492 per square foot. 1635 Kains Ave is a home located in Alameda County with nearby schools including Ruth Acty Elementary, Rosa Parks Elementary School, and Berkeley Arts Magnet at Whittier School.
Ownership History
Date
Name
Owned For
Owner Type
Purchase Details
Closed on
Nov 5, 2001
Sold by
Grabia Saul and Young Susan
Bought by
Grabia Saul and Young Grabia Susan
Current Estimated Value
Home Financials for this Owner
Home Financials are based on the most recent Mortgage that was taken out on this home.
Original Mortgage
$500,000
Outstanding Balance
$193,984
Interest Rate
6.62%
Estimated Equity
$1,130,811
Purchase Details
Closed on
Oct 19, 1999
Sold by
Amerus Bank
Bought by
Grabia Saul and Young Susan
Home Financials for this Owner
Home Financials are based on the most recent Mortgage that was taken out on this home.
Original Mortgage
$278,100
Interest Rate
7.75%
Purchase Details
Closed on
Aug 28, 1998
Sold by
Scott Gregory D
Bought by
Amerus Bank
Purchase Details
Closed on
Apr 3, 1995
Sold by
Scott Bonita C and Scott Gregory D
Bought by
Scott Gregory D
Home Financials for this Owner
Home Financials are based on the most recent Mortgage that was taken out on this home.
Original Mortgage
$289,800
Interest Rate
9.25%
Create a Home Valuation Report for This Property
The Home Valuation Report is an in-depth analysis detailing your home's value as well as a comparison with similar homes in the area
Home Values in the Area
Average Home Value in this Area
Purchase History
| Date | Buyer | Sale Price | Title Company |
|---|---|---|---|
| Grabia Saul | -- | Placer Title Company | |
| Grabia Saul | $309,000 | First American Title Guarant | |
| Amerus Bank | $240,000 | First American Title | |
| Scott Gregory D | -- | First American Title Guarant |
Source: Public Records
Mortgage History
| Date | Status | Borrower | Loan Amount |
|---|---|---|---|
| Open | Grabia Saul | $500,000 | |
| Closed | Grabia Saul | $278,100 | |
| Previous Owner | Scott Gregory D | $289,800 |
Source: Public Records
Tax History
| Year | Tax Paid | Tax Assessment Tax Assessment Total Assessment is a certain percentage of the fair market value that is determined by local assessors to be the total taxable value of land and additions on the property. | Land | Improvement |
|---|---|---|---|---|
| 2025 | $11,157 | $467,898 | $142,469 | $332,429 |
| 2024 | $11,157 | $458,588 | $139,676 | $325,912 |
| 2023 | $10,884 | $456,460 | $136,938 | $319,522 |
| 2022 | $10,591 | $440,511 | $134,253 | $313,258 |
| 2021 | $10,554 | $431,738 | $131,621 | $307,117 |
| 2020 | $9,724 | $434,243 | $130,273 | $303,970 |
| 2019 | $9,058 | $425,730 | $127,719 | $298,011 |
| 2018 | $8,849 | $417,384 | $125,215 | $292,169 |
| 2017 | $8,522 | $409,201 | $122,760 | $286,441 |
| 2016 | $11,109 | $401,180 | $120,354 | $280,826 |
| 2015 | $10,974 | $395,154 | $118,546 | $276,608 |
| 2014 | $7,890 | $387,414 | $116,224 | $271,190 |
Source: Public Records
Map
Nearby Homes
- 1728 Curtis St
- 1631 Belvedere Ave
- 1128 Delaware St
- 995 Virginia St
- 1322 Virginia St
- 940 Delaware St
- 1261 Hearst Ave
- 1919 Curtis St
- 921 Jones St
- 1400 Santa fe Ave
- 1339 Kains Ave
- 2013 9th St
- 817 Delaware St
- 1368 Rose St
- 817 Jones St
- 1411 Hearst Ave Unit 2
- 1234 Stannage Ave
- 2144 Curtis St
- 1436 Delaware St
- 1564 Sacramento St
- 1641 Kains Ave
- 1633 Kains Ave
- 1645 Kains Ave
- 1629 Kains Ave
- 1638 Stannage Ave
- 1636 Stannage Ave
- 1630 Stannage Ave
- 1625 Kains Ave
- 1642 Stannage Ave
- 1131 Virginia St
- 1636 Kains Ave
- 1632 Kains Ave
- 1137 Virginia St
- 1626 Stannage Ave
- 1640 Kains Ave
- 1630 Kains Ave
- 1628 Kains Ave
- 1654 Kains Ave
- 1623 Kains Ave
- 1622 Stannage Ave
Your Personal Tour Guide
Ask me questions while you tour the home.