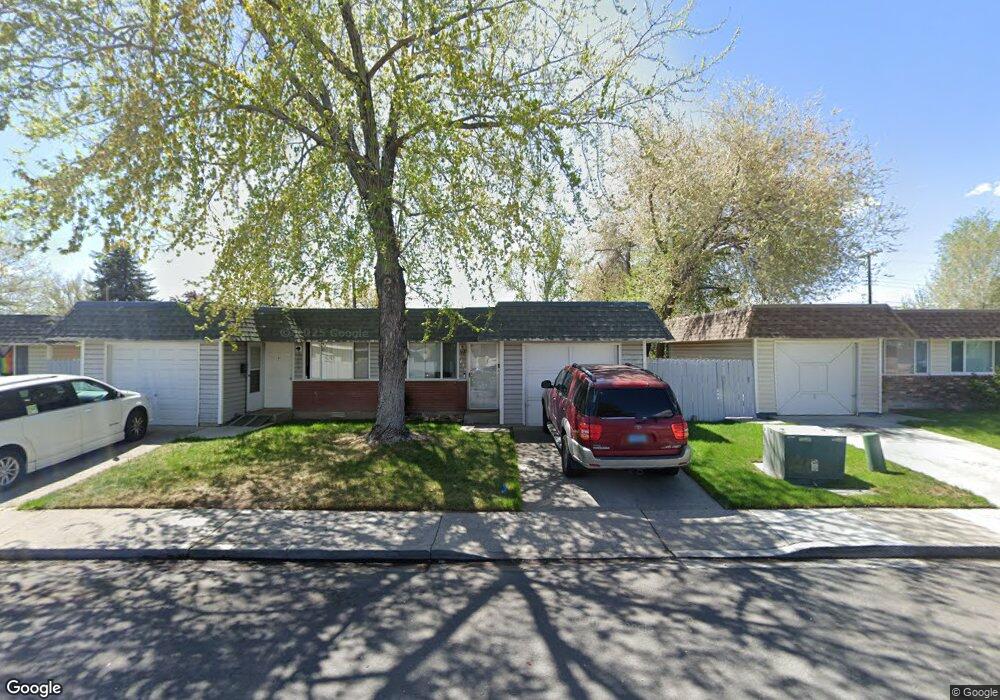
1635 Sue Way Unit A Sparks, NV 89431
North Rock NeighborhoodEstimated Value: $279,000 - $313,000
3
Beds
2
Baths
1,044
Sq Ft
$289/Sq Ft
Est. Value
About This Home
This home is located at 1635 Sue Way Unit A, Sparks, NV 89431 and is currently estimated at $301,579, approximately $288 per square foot. 1635 Sue Way Unit A is a home located in Washoe County with nearby schools including Alice Maxwell Elementary School, Sparks Middle School, and Sparks High School.
Ownership History
Date
Name
Owned For
Owner Type
Purchase Details
Closed on
Nov 22, 2005
Sold by
Risse Danielle C and Cozart Danielle C
Bought by
Risse Danielle C
Current Estimated Value
Home Financials for this Owner
Home Financials are based on the most recent Mortgage that was taken out on this home.
Original Mortgage
$138,750
Outstanding Balance
$75,698
Interest Rate
5.97%
Mortgage Type
New Conventional
Estimated Equity
$225,881
Purchase Details
Closed on
Aug 12, 2004
Sold by
Saveli Adrianne
Bought by
Cozart Danielle C
Home Financials for this Owner
Home Financials are based on the most recent Mortgage that was taken out on this home.
Original Mortgage
$101,720
Interest Rate
6.5%
Mortgage Type
Unknown
Purchase Details
Closed on
Aug 25, 1995
Sold by
Miller Kevin Dean and Miller Donna Denise
Bought by
Savell Adrianne
Home Financials for this Owner
Home Financials are based on the most recent Mortgage that was taken out on this home.
Original Mortgage
$68,875
Interest Rate
7.5%
Create a Home Valuation Report for This Property
The Home Valuation Report is an in-depth analysis detailing your home's value as well as a comparison with similar homes in the area
Home Values in the Area
Average Home Value in this Area
Purchase History
| Date | Buyer | Sale Price | Title Company |
|---|---|---|---|
| Risse Danielle C | -- | First American Title | |
| Cozart Danielle C | $127,500 | First Centennial Title Co | |
| Savell Adrianne | $72,500 | Western Title Company Inc |
Source: Public Records
Mortgage History
| Date | Status | Borrower | Loan Amount |
|---|---|---|---|
| Open | Risse Danielle C | $138,750 | |
| Closed | Cozart Danielle C | $101,720 | |
| Previous Owner | Savell Adrianne | $68,875 | |
| Closed | Cozart Danielle C | $25,430 |
Source: Public Records
Tax History Compared to Growth
Tax History
| Year | Tax Paid | Tax Assessment Tax Assessment Total Assessment is a certain percentage of the fair market value that is determined by local assessors to be the total taxable value of land and additions on the property. | Land | Improvement |
|---|---|---|---|---|
| 2025 | $594 | $40,685 | $27,370 | $13,315 |
| 2024 | $577 | $39,264 | $25,830 | $13,434 |
| 2023 | $577 | $34,225 | $22,645 | $11,580 |
| 2022 | $555 | $28,296 | $18,480 | $9,816 |
| 2021 | $561 | $21,456 | $11,830 | $9,626 |
| 2020 | $527 | $21,861 | $11,830 | $10,031 |
| 2019 | $512 | $22,132 | $12,040 | $10,092 |
| 2018 | $497 | $17,548 | $7,350 | $10,198 |
| 2017 | $483 | $17,159 | $6,720 | $10,439 |
| 2016 | $471 | $16,371 | $5,495 | $10,876 |
| 2015 | $470 | $15,874 | $4,445 | $11,429 |
| 2014 | $455 | $14,255 | $3,045 | $11,210 |
| 2013 | -- | $13,776 | $2,415 | $11,361 |
Source: Public Records
Map
Nearby Homes
- 1620 Gault Way
- 1731 Gault Way Unit D
- 1595 York Way
- 0 N Mccarran Blvd Unit 250052909
- 1345 Plymouth Way
- 2154 Oppio St
- 1125 Dodson Way
- 1160 York Way
- 1655 Byrd Dr
- 1799 Vance Way
- 1110 Xman Way
- 3269 Valley Forge Way
- 1124 Sbragia Way
- 1780 Greenbrae Dr
- 5530 High Rock Way
- 1003 Sbragia Way
- 1121 Greenbrae Dr
- 1365 Prospect Ave
- 3116 Sterling Ridge Cir
- 3516 Brassie Dr
- 1633 Sue Way
- 1655 Sue Way Unit B
- 1615 Sue Way Unit C
- 1657 Sue Way
- 1613 Sue Way
- 1665 Sue Way
- 1620 Plymouth Way
- 1667 Sue Way Unit C
- 1640 Plymouth Way
- 2625 16th St
- 2657 16th St
- 1646 Sue Way Unit A
- 1648 Sue Way Unit B
- 2659 16th St
- 1673 Sue Way Unit B
- 1660 Sue Way
- 1660 Plymouth Way
- 1662 Sue Way
- 1675 Sue Way Unit 8
- 1683 Sue Way Unit C