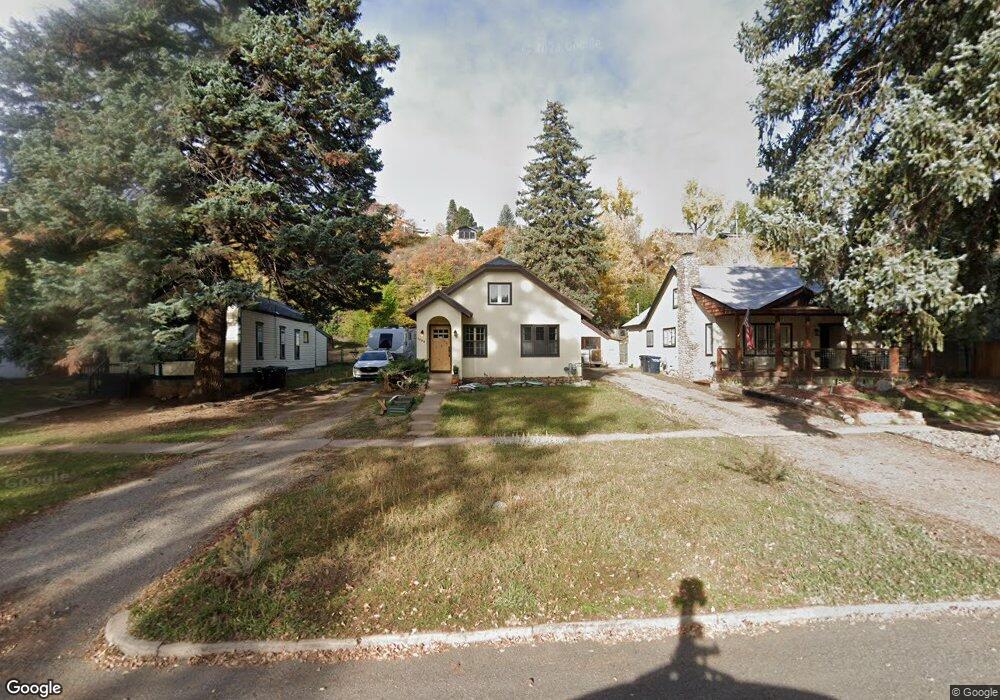
1635 W 3rd Ave Durango, CO 81301
Crestview NeighborhoodEstimated Value: $623,000 - $793,000
2
Beds
1
Bath
1,260
Sq Ft
$542/Sq Ft
Est. Value
About This Home
This home is located at 1635 W 3rd Ave, Durango, CO 81301 and is currently estimated at $683,225, approximately $542 per square foot. 1635 W 3rd Ave is a home located in La Plata County with nearby schools including Needham Elementary School, Miller Middle School, and Durango High School.
Create a Home Valuation Report for This Property
The Home Valuation Report is an in-depth analysis detailing your home's value as well as a comparison with similar homes in the area
Home Values in the Area
Average Home Value in this Area
Tax History
| Year | Tax Paid | Tax Assessment Tax Assessment Total Assessment is a certain percentage of the fair market value that is determined by local assessors to be the total taxable value of land and additions on the property. | Land | Improvement |
|---|---|---|---|---|
| 2025 | $1,563 | $41,230 | $15,260 | $25,970 |
| 2024 | $1,330 | $33,090 | $11,070 | $22,020 |
| 2023 | $1,330 | $36,120 | $12,090 | $24,030 |
| 2022 | $1,191 | $38,150 | $12,770 | $25,380 |
| 2021 | $1,196 | $30,130 | $10,970 | $19,160 |
| 2020 | $1,107 | $28,800 | $10,810 | $17,990 |
| 2019 | $1,059 | $28,800 | $10,810 | $17,990 |
| 2018 | $1,000 | $27,530 | $10,300 | $17,230 |
| 2017 | $978 | $27,530 | $10,300 | $17,230 |
| 2016 | $898 | $27,540 | $9,820 | $17,720 |
| 2015 | $841 | $27,540 | $9,820 | $17,720 |
| 2014 | -- | $23,490 | $9,440 | $14,050 |
| 2013 | -- | $23,490 | $9,440 | $14,050 |
Source: Public Records
Map
Nearby Homes
- 1840 W 3rd Ave
- 1857 & 1865 W 3rd Ave
- 1867 W 2nd Ave
- TBD - Lot G Highway 550
- TBD (Tract C) Highway 550
- 49789 Highway 550
- 1201 Main Ave Unit 105
- 12 Falcon Way
- 1404 E 3rd Ave
- 1330 E 3rd Ave
- 125 W 10th St Unit 104
- 485 Florida Rd Unit B-15
- 485 Florida Rd Unit C-17
- 362 W 23rd St
- TBD Wilson Gulch Rd
- 768 Main Ave Unit 4
- 773 E 3rd Ave
- 0 Tbd Unit 11662135
- 0 Tbd Unit 26426680
- 2400 Arroyo Dr Unit 22
- 1631 W 3rd Ave
- 1639 W 3rd Ave
- 1625 W 3rd Ave
- 1689 W 3rd Ave
- 1609 W 3rd Ave
- 68 Double Diamond Lot 17 Dr
- 1601 W 3rd Ave
- 1732 Crestview Dr
- 1736 Crestview Dr
- 1711 W 3rd Ave
- 1728 Crestview Dr
- 1638 W 3rd Ave
- 1812 Crestview Dr
- 1604 W 3rd Ave
- 1660 W 3rd Ave
- 1680 W 3rd Ave
- 1676 W 3rd Ave
- 1563 W 3rd Ave
- 1620 W 3rd Ave
- 1724 Crestview Dr
Your Personal Tour Guide
Ask me questions while you tour the home.